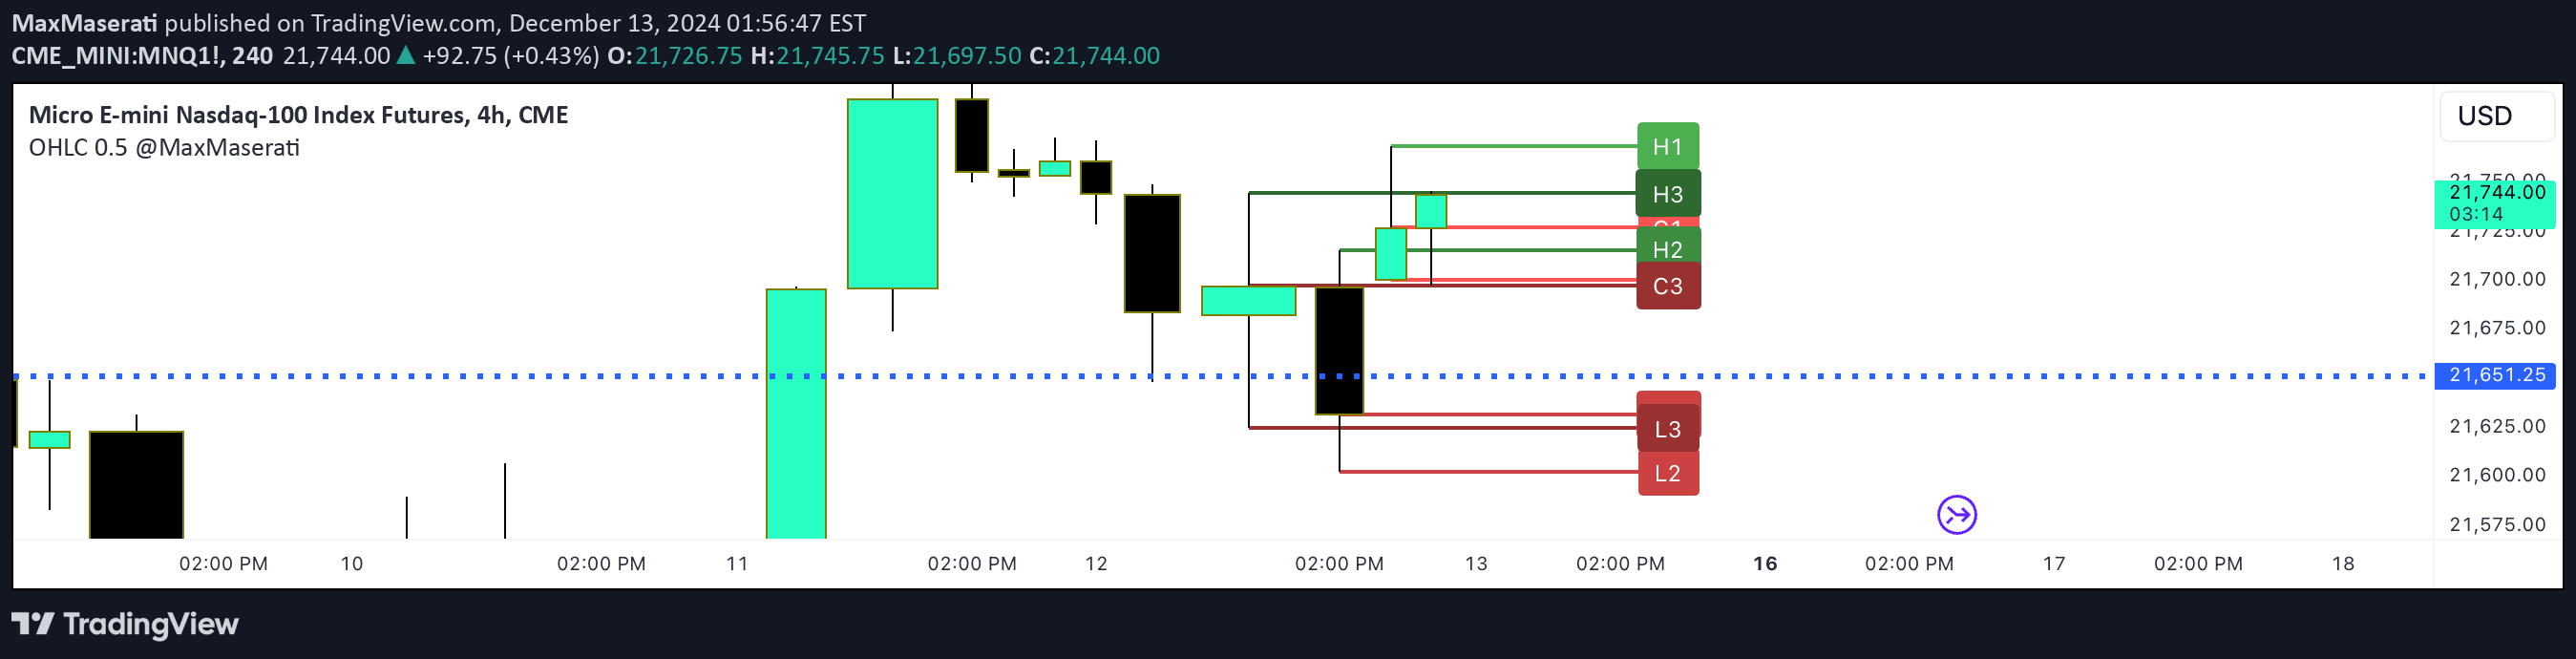
Previous Highs & Lows [LuxAlgo]
A trading indicator that highlights previous market highs and lows, creating customizable support and resistance zones across multiple timeframes to help traders identify potential price reaction levels.
Explore 11,183 indicators. Filter beyond the obvious.
Discover the tools that fit the way you trade.
11,183 tools to explore
A trading indicator that highlights previous market highs and lows, creating customizable support and resistance zones across multiple timeframes to help traders identify potential price reaction levels.
A volume-based trading tool that identifies market imbalances by analyzing premium and discount zones, calculating delta volume to reveal potential price reversals and trend strength.
A sophisticated market structure indicator using Donchian Channels to identify trading opportunities by highlighting order flow, structural changes, and potential premium/discount areas.
A sophisticated trading oscillator that identifies premium and discount zones, breaks of structure, and change of character using smart money concepts for advanced trend analysis.
An advanced Smart Money Concept indicator that identifies swing high and low zones, helping traders determine premium and discount areas for optimal trade positioning and market structure analysis.
An advanced market structure screener that identifies key pivot points, trend changes, and institutional trading behaviors across multiple symbols using Smart Money Concepts.
A flexible signal adapter script that allows traders to combine up to eight external indicators to create custom trading signals without complex coding, suitable for strategy prototyping.
A custom indicator for marking Premium and Discount price zones with configurable range settings and focused trading analysis using ICT concepts.
The Stablecoin Supply Ratio Oscillator analyzes market sentiment by comparing Bitcoin's market cap to stablecoin market caps, using z-score transformation to identify potential market turning points.
A straddle strategy analyzing call and put option prices to predict potential market movement within a specific range using technical indicators like Supertrend and EMA.
An advanced trading indicator that calculates price premium and discount zones using previous candle data, offering insights into potential entry and exit points for traders.
A visual trading indicator using EMA crossovers to analyze market flow, showing buy and sell pressure, trend direction, and potential reversals with color-coded candles.
Likes, views, and comments are historical TradingView snapshots. They describe attention, not trading performance.