
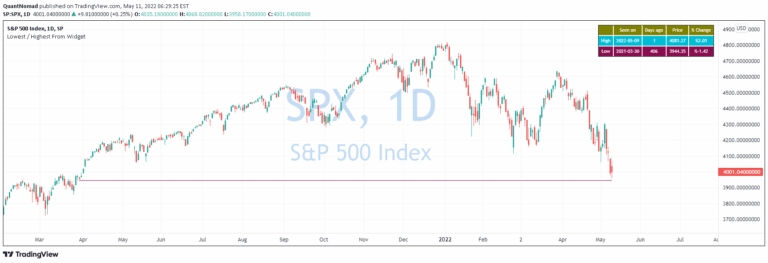
Lowest / Highest From Widget
A widget that identifies the most recent day when price was higher or lower than the current value, visualizing historical price comparisons through lines and informative tables.
Explore 11,183 indicators. Filter beyond the obvious.
Discover the tools that fit the way you trade.
11,183 tools to explore
A widget that identifies the most recent day when price was higher or lower than the current value, visualizing historical price comparisons through lines and informative tables.
Previous OHLC tracks the opening, high, low, and closing prices from the last trading period, providing key insights into market sentiment and potential price action.
The Previous Day's High and Low Indicator marks key price levels from the previous trading day, helping traders identify potential breakout and breakdown zones.
Likes, views, and comments are historical TradingView snapshots. They describe attention, not trading performance.