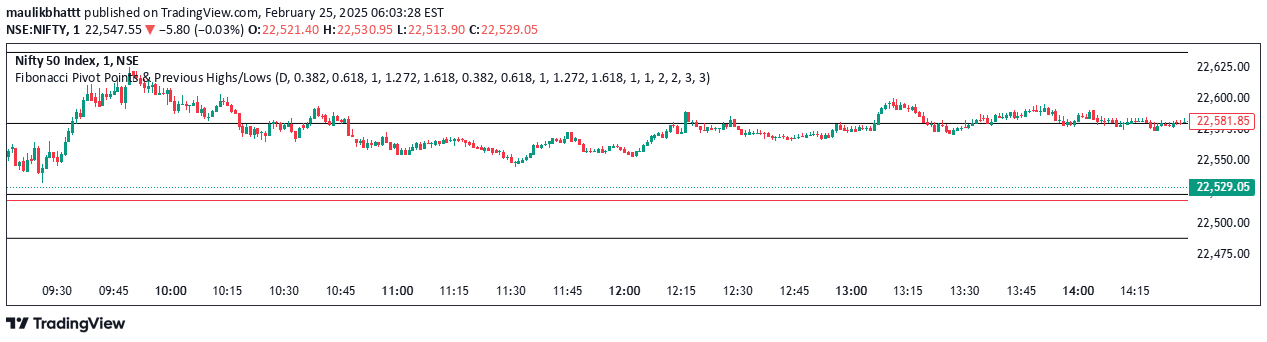
Previous OHLC tracks the opening, high, low, and closing prices from the last trading period, providing key insights into market sentiment and potential price action.
Explore complementary indicator rolesHow it works
Previous OHLC calculates the opening, high, low, and closing prices from the immediately preceding trading period, serving as a snapshot of recent market activity. These values are automatically plotted on the current chart, allowing traders to quickly reference the previous period's price dynamics.
The indicator tracks four specific price points: the opening price at the start of the last period, the highest price reached, the lowest price recorded, and the final closing price. By displaying these values, traders can visually compare current market conditions against the most recent historical price movement.
Why it may be useful
Previous OHLC provides traders with a critical reference point for understanding recent market sentiment and potential future price movements. By offering a clear view of the previous period's price action, traders can identify potential support and resistance levels, gauge market momentum, and make more informed trading decisions.
These price points help traders understand the strength of current market trends, potential reversal points, and overall market psychology. The indicator serves as a valuable tool for technical analysis, offering insights into how prices have recently behaved and potentially indicating future market direction.
When to explore it
Previous OHLC is most effective when used in conjunction with other technical indicators and during periods of consistent market trends. Traders can utilize this tool across various timeframes, from short-term scalping to longer-term swing trading, to gain insights into recent price dynamics.
The indicator works particularly well in markets with clear trend patterns and when combined with other analytical tools like RSI, MACD, or volume indicators. Traders should pay special attention to significant differences between previous period's open, high, low, and close prices as potential signals for market sentiment and potential price movements.
Keep exploring
What we’ve verified
Access, alerts and repainting behaviour have not been independently verified for this indicator. Check the creator’s current publication and settings.
General descriptions and classifications are recovered research. Verified details above identify the specific checks we have completed. Check the creator’s current publication for later changes.