HTF Liquidity Levels
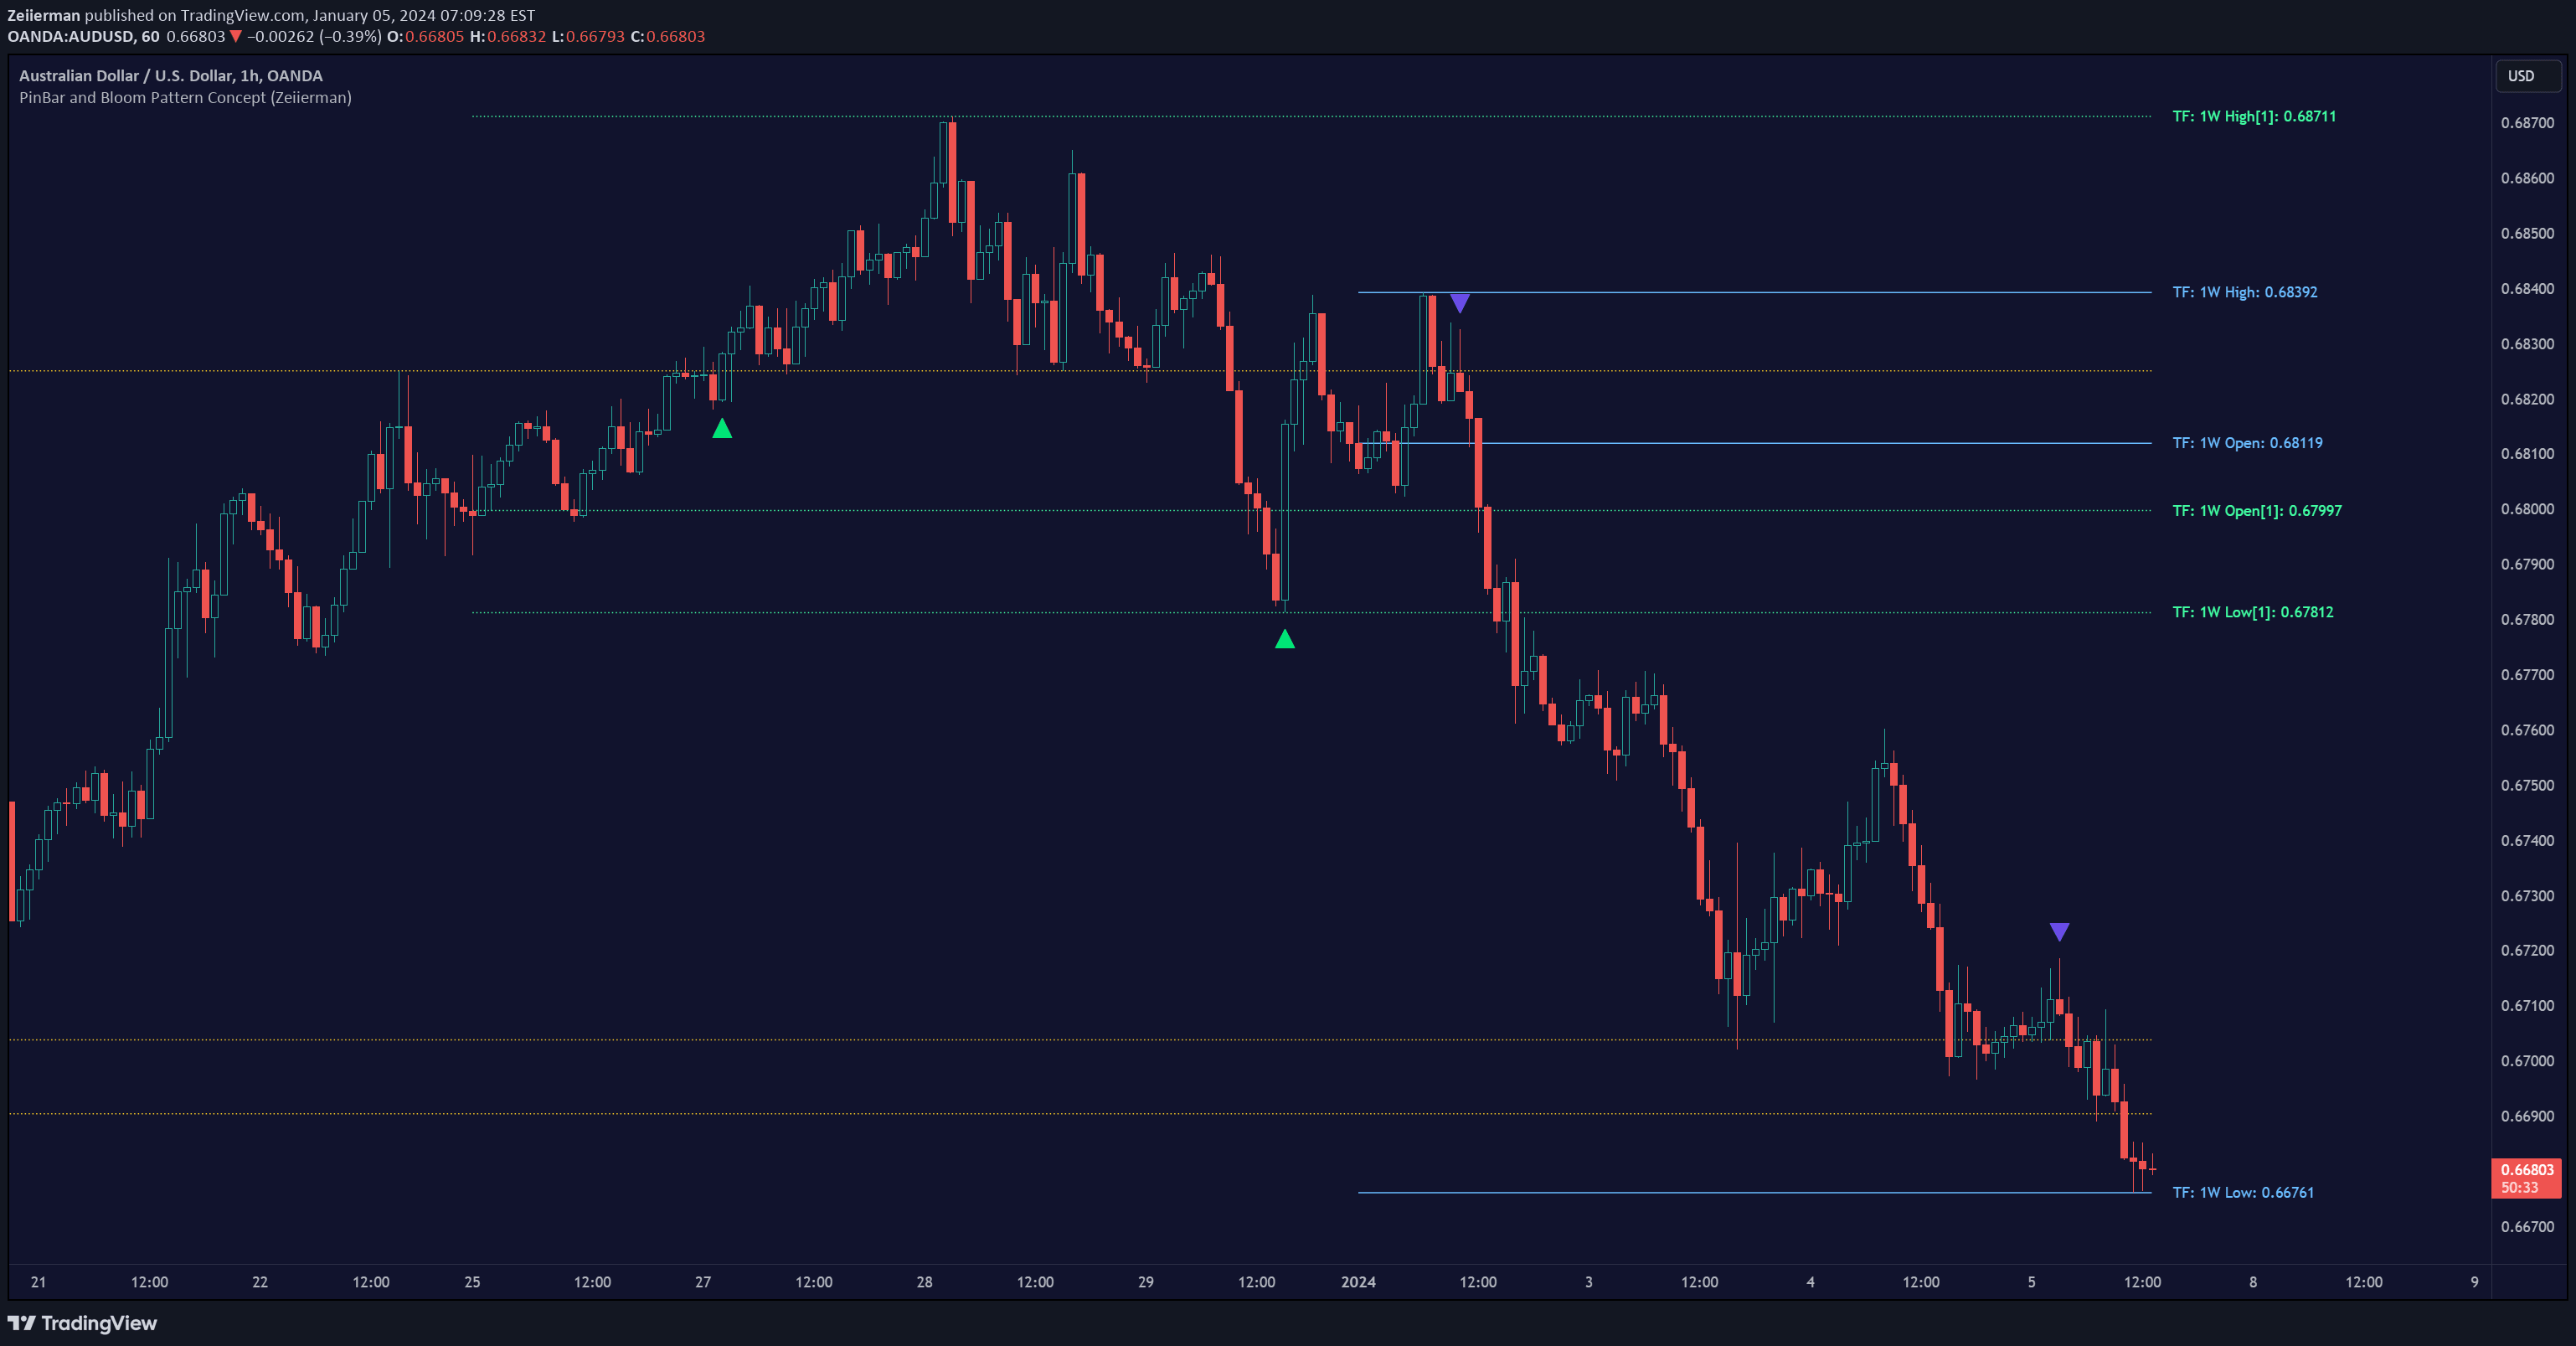
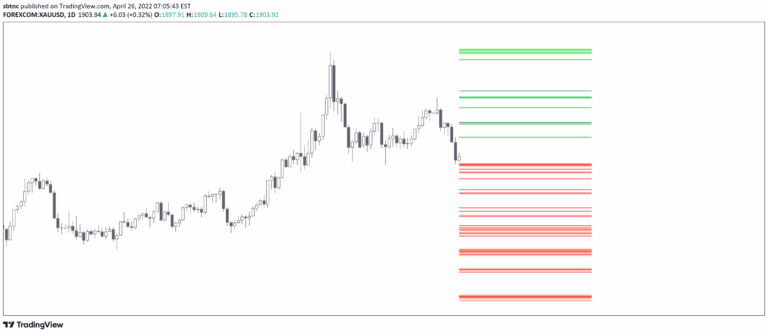
A trading indicator that identifies untapped liquidity levels across different timeframes, helping traders understand potential price movement magnets and liquidity pools in the market.
Explore 11,183 indicators. Filter beyond the obvious.
Discover the tools that fit the way you trade.
11,183 tools to explore
A trading indicator that identifies untapped liquidity levels across different timeframes, helping traders understand potential price movement magnets and liquidity pools in the market.
A technical indicator that highlights previous day's high and low points, uses daily and weekly separators to create a clean chart that helps traders understand potential market direction.
A trading indicator that highlights previous market highs and lows, creating customizable support and resistance zones across multiple timeframes to help traders identify potential price reaction levels.
A trading strategy analyzing candlestick patterns using symmetry, baseline bound, and specific pattern recognition to identify potential market trend reversals and continuations.
A trading signal that identifies potential market reversals by analyzing price symmetry, baseline boundaries, and precision pin bar formations for precise entry and exit points.
A highly configurable indicator that tracks previous key price levels across multiple timeframes, allowing traders to identify important support, resistance, and liquidity zones with customizable settings.
An advanced trading tool that automatically plots opening range and previous day's high/low levels to help traders identify potential market sentiment and trading opportunities.
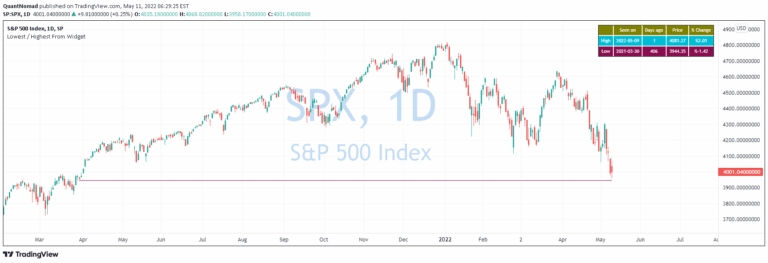
A widget that identifies the most recent day when price was higher or lower than the current value, visualizing historical price comparisons through lines and informative tables.
An advanced market structure indicator that identifies potential trend reversals by detecting Break of Structure (BoS) and Change of Character (CHoCH) signals with visual and alert features.
A dynamic trading indicator tracking previous and current day high/low levels with customizable visualization to help traders identify key support and resistance zones throughout the trading session.
A dynamic indicator tracking previous day's key price levels including high, low, close, and VWAP with customizable visual settings for traders seeking daily reference points.
Previous OHLC tracks the opening, high, low, and closing prices from the last trading period, providing key insights into market sentiment and potential price action.
Likes, views, and comments are historical TradingView snapshots. They describe attention, not trading performance.