Manual Harmonic Patterns - With interactive inputs
A drawing tool for identifying XABCD harmonic patterns on trading charts, allowing manual selection of pivot points to detect potential trend reversal or continuation zones.
Explore 11,183 indicators. Filter beyond the obvious.
Discover the tools that fit the way you trade.
11,183 tools to explore
A drawing tool for identifying XABCD harmonic patterns on trading charts, allowing manual selection of pivot points to detect potential trend reversal or continuation zones.
The Fear & Greed Index measures market sentiment by analyzing seven key market indicators, providing traders with insights into potential market behavior and emotional extremes.
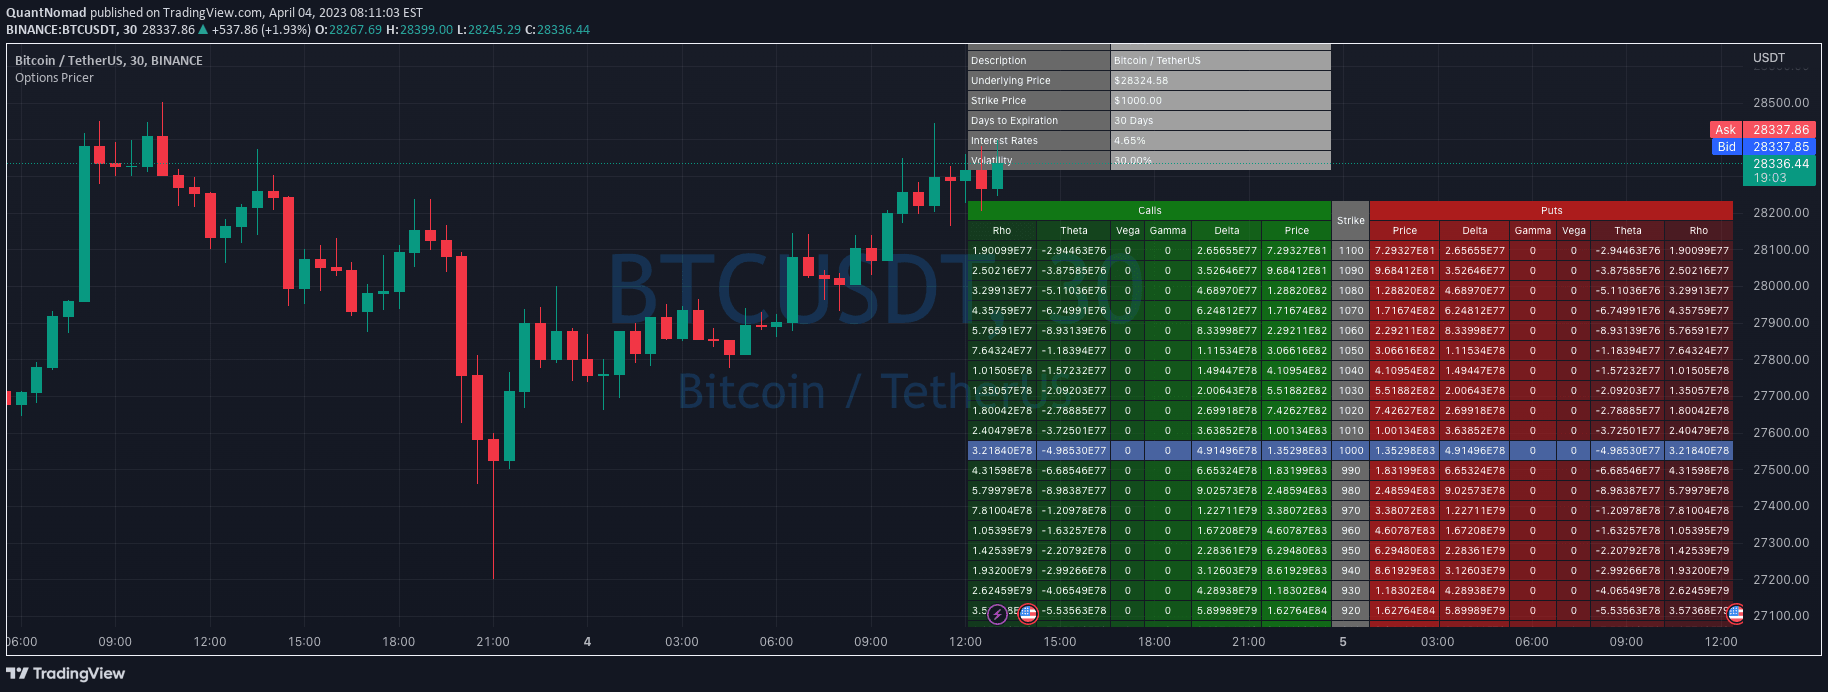
A TradingView option pricing tool that computes option prices and greeks for both put and call options using strikes, implied volatility, and days to expiry.
A dynamic trading tool that identifies price breakouts using candlestick analysis and volume, generating buy/sell signals with breakout levels and take-profit targets.
A straddle strategy analyzing call and put option prices to predict potential market movement within a specific range using technical indicators like Supertrend and EMA.
An options dashboard displaying real-time call and put strike prices across 16 strikes, helping traders analyze market sentiment and potential trend direction through options data visualization.
The Black-Scholes-Merton model is a sophisticated options pricing framework that calculates theoretical option values using key financial parameters and multiple Greek sensitivity measures.
Option Volume indicator tracks and visualizes volume activity for up to 10 custom option strike symbols, offering individual and cumulative volume display modes for real-time option flow analysis.
A trading strategy tracking previous day's price range and identifying market bias based on creating new highs or lows relative to the previous day's range.
A trading signal using short-term and long-term exponential moving averages to identify bullish and bearish trade entries and exits based on EMA crossovers and overbought/oversold conditions.
Options Volume Profile is an advanced indicator that visualizes options market activity, revealing institutional positioning, volume distribution, and potential support/resistance levels across different strikes.
A binary options trading strategy focused on evaluating trade signals based on candle colors, using specific parameters like Martingale levels and trading sessions.
Likes, views, and comments are historical TradingView snapshots. They describe attention, not trading performance.