FX Market Sessions
An FX market indicator that segments trading times into specific zones, providing visual guidance for traders using timeframes of 60 minutes or less.
Explore 11,183 indicators. Filter beyond the obvious.
Discover the tools that fit the way you trade.
11,183 tools to explore
An FX market indicator that segments trading times into specific zones, providing visual guidance for traders using timeframes of 60 minutes or less.
An advanced trading indicator that detects instantaneously mitigated fair value gaps, providing signals based on rapid price corrections and market imbalances.
Tick Chart is a unique charting method that creates candlesticks based on a specific number of price ticks, offering an alternative to time-based charts for analyzing market movements.
The 2B reversal pattern identifies potential market trend reversals by detecting false breakouts and price rebounds, signaling opportune entry points for traders.
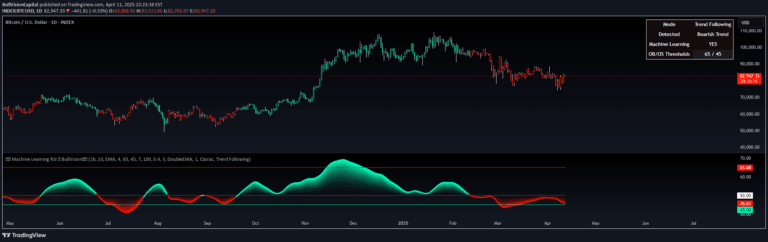
A sophisticated RSI indicator that uses machine learning and K-Nearest Neighbors to dynamically adapt momentum analysis by comparing current market conditions with historical patterns.
SwingArms is a color-coded trend indicator that visually confirms market trend changes using green and red signals for bullish and bearish movements respectively.
A comprehensive multi-indicator script that displays various technical indicators in separate windows, allowing traders to customize and analyze market momentum, volume, and trend signals.
A dynamic trading panel displaying multiple technical indicators in a color-coded table format, allowing traders to quickly assess market conditions across multiple symbols simultaneously.
A trading tool highlighting specific time-based market zones and Fibonacci retracements to identify optimal entry points across different forex trading sessions.
An advanced market structure indicator that identifies intrabar trend dynamics using Break of Structure (BoS) and Change of Character (CHoCH) patterns for real-time market analysis.
A customizable Pine Script indicator that generates a mini-chart displaying the last 10 candles with detailed visual settings, providing quick insights into recent price action and market behavior.
A machine learning-enhanced momentum oscillator that analyzes market trends using weighted moving averages and k-Nearest Neighbors algorithm for dynamic and adaptive momentum prediction.
Likes, views, and comments are historical TradingView snapshots. They describe attention, not trading performance.