Analyst Table (Zeiierman)
Analyst Table provides comprehensive visual representation of analyst estimates and recommendations, displaying price targets and sentiment directly on the trading chart for quick market insights.
Explore 11,183 indicators. Filter beyond the obvious.
Discover the tools that fit the way you trade.
11,183 tools to explore
Analyst Table provides comprehensive visual representation of analyst estimates and recommendations, displaying price targets and sentiment directly on the trading chart for quick market insights.
A trading indicator that generates buy and sell arrows using VWAP, moving averages, and RSI to help traders identify potential market entry and exit points.
RSI3M3+ is an advanced trading indicator blending Relative Strength Index with Walter Bressert's cycle analysis to identify optimal trading entry and exit points based on market momentum and cyclical patterns.
A comprehensive trading tool that calculates liquidation prices, helps manage Dollar Cost Averaging (DCA) strategies, and provides risk management insights for traders.
A trading exit signal that combines RSI and MACD to help traders identify optimal points to close long and short positions with dynamic volatility adjustments.
A comprehensive trading dashboard that aggregates critical company information, fundamental data, price metrics, and analyst ratings into a single, easy-to-view analytical tool.
A risk management tool that helps traders calculate optimal position sizes and stop losses based on account size, purchase price, and individual risk tolerance.
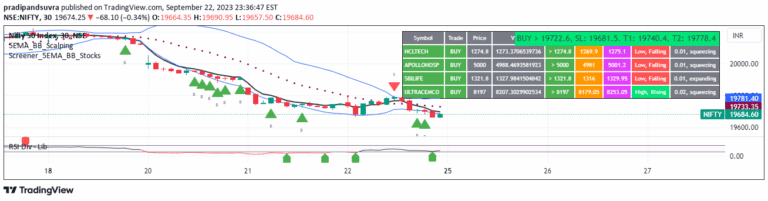
A dynamic trading scanner that identifies potential buy and sell signals for Nifty-50 stocks using 5-EMA and Bollinger Bands, providing real-time trade recommendations.
A custom speedometer visualization tool that converts complex market data like analyst recommendations and put-call ratios into an intuitive graphical representation of market sentiment and trend.
An automated tool that scans multiple EMA lengths to find the most statistically robust moving average for trading, helping traders optimize their technical analysis strategy.
MFI Nexus Pro is a comprehensive trading indicator that analyzes cash flows, using multiple moving averages, Bollinger Bands, and divergence signals to generate precise buy and sell recommendations.
A specialized indicator designed to simplify and streamline scalping entry points specifically for gold trading, providing traders with quick and precise trading signals.
Likes, views, and comments are historical TradingView snapshots. They describe attention, not trading performance.