YOUR INDICATOR RESEARCH STARTS HERE

Find the right indicator.
Understand what it does.

Explore 11,183 indicators. Filter beyond the obvious.
Discover the tools that fit the way you trade.

THE INDICATOR LIBRARY

Results for “so”

11,183 tools to explore

946 indicators matching your filters
Save search
TrendMomentumEditor’s pick

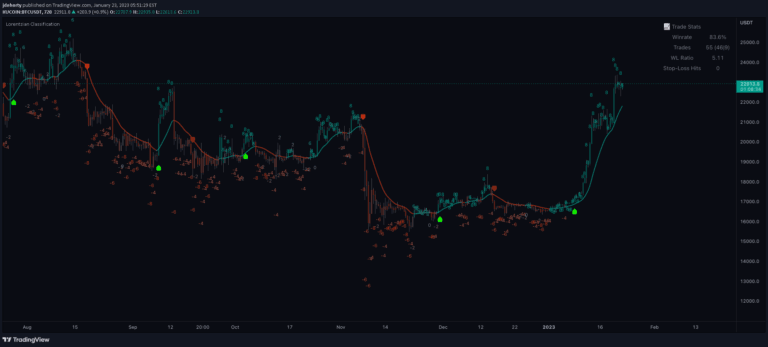
Machine Learning: Lorentzian Classification

by jdehorty

A machine learning trading signal using Lorentzian Distance Classifier to predict price movements by analyzing historical data patterns and identifying nearest neighbors in a multi-dimensional feature space.

Main price chartDay Trading · Swing Trading
Explore
24Klikes857.3Kviews784comments
Save
TrendMomentumEditor’s pick

Divergence for Many Indicators v4

by LonesomeTheBlue

Advanced trading tool that detects divergences across multiple technical indicators, helping traders identify potential trend reversals and momentum shifts through comprehensive pivot point analysis.

Main price chartDay Trading · Swing Trading
Explore
23.6Klikes661Kviews695comments
Save
TrendVolatilityEditor’s pick

Pivot Point Supertrend

by LonesomeTheBlue

Pivot Point SuperTrend is an advanced trend-following indicator that combines pivot points with SuperTrend to generate more reliable trading signals and identify potential trend reversals.

Main price chartDay Trading · Swing Trading
Explore
21.7Klikes714Kviews217comments
Save
TrendMomentumEditor’s pick

Linear Regression Channel

by LonesomeTheBlue

A Linear Regression Channel indicator that tracks price trends, identifies channel breakouts, and analyzes momentum direction using dynamic visual signals and customizable settings.

Main price chart · unverifiedDay Trading · Swing Trading
Explore
13.8Klikes407.9Kviews126comments
Save
VolumeEditor’s pick

Volume Profile / Fixed Range

by LonesomeTheBlue

A Volume Profile indicator that calculates trading volumes within a fixed range, helping traders understand volume distribution and identifying key price levels with visual representation.

Main price chart · unverifiedDay Trading · Swing Trading
Explore
13.4Klikes576.6Kviews171comments
Save
TrendMomentumEditor’s pick

Linear Regression Oscillator [ChartPrime]

by ChartPrime

A custom indicator using linear regression to analyze closing prices, helping traders identify market trends, mean reversion, and potential overbought or oversold conditions across different timeframes.

Separate pane · unverifiedDay Trading · Swing Trading
Explore
10.5Klikes214.9Kviews76comments
Save
TrendVolatilityEditor’s pick

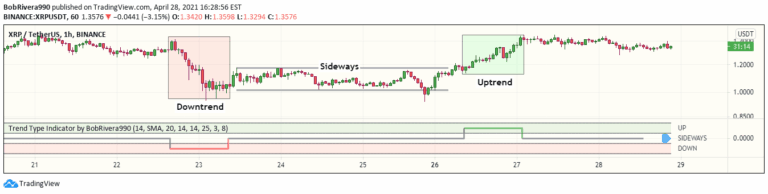
Trend Type Indicator by BobRivera990

by BobRivera990

A technical analysis signal that uses ATR and ADX to detect market trends, distinguishing between uptrend, downtrend, and sideways movements by analyzing price volatility and directional momentum.

Separate pane · unverifiedSwing Trading
Explore
10.3Klikes285.2Kviews136comments
Save
TrendMomentumEditor’s pick

Trading ABC

by LonesomeTheBlue

An advanced pattern recognition indicator that identifies ABC chart patterns using trend cloud, ZigZag, and Fibonacci levels to detect potential trading opportunities with customizable settings.

Main price chart · unverifiedDay Trading · Swing Trading
Explore
9.6Klikes190.9Kviews109comments
Save
TrendEditor’s pick

Cup Finder

by LonesomeTheBlue

A technical analysis script that identifies cup-like price formations by creating channels and tracking potential breakout points in financial markets using specific bar search and channel width parameters.

Main price chart · unverifiedSwing Trading
Explore
9.1Klikes127Kviews90comments
Save
TrendVolatilityEditor’s pick

Support Resistance MTF

by LonesomeTheBlue

A multi-timeframe support and resistance indicator that helps traders identify key price levels by analyzing market data across different time frames and customizable settings.

Main price chart · unverifiedDay Trading · Swing Trading
Explore
8.9Klikes368.4Kviews103comments
Save
VolumeEditor’s pick

Tick Chart

by LonesomeTheBlue

Tick Chart is a unique charting method that creates candlesticks based on a specific number of price ticks, offering an alternative to time-based charts for analyzing market movements.

Main price chart · unverifiedScalping · Day Trading
Explore
7.5Klikes149.3Kviews105comments
Save

Likes, views, and comments are historical TradingView snapshots. They describe attention, not trading performance.

START WITH A QUESTION

A little less searching.
A lot more understanding.

Tell DeepAlpha what you need. Get an explanation, a shortlist,
and a direct path to the indicators behind it.

Ask DeepAlpha