
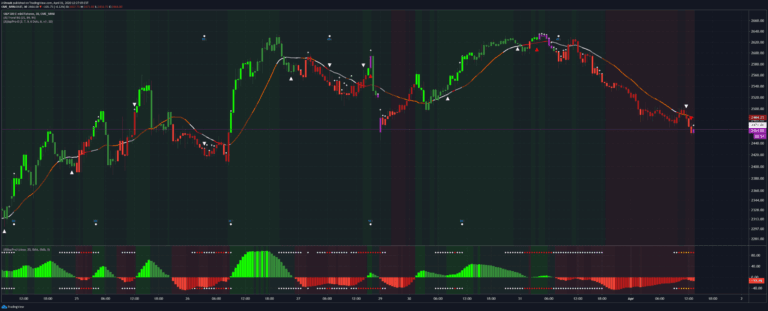
(JS) Squeeze Pro Overlays
A multi-feature trading signal indicator that identifies market squeeze conditions using Bollinger Bands and Keltner Channels with customizable overlay options for entry and exit signals.
Explore 11,183 indicators. Filter beyond the obvious.
Discover the tools that fit the way you trade.
11,183 tools to explore
A multi-feature trading signal indicator that identifies market squeeze conditions using Bollinger Bands and Keltner Channels with customizable overlay options for entry and exit signals.
A dynamic trend indicator that uses moving averages and streak analysis to identify market momentum, potential reversals, and provide visual trend insights across multiple price data points.
A trading tool that automatically identifies and labels swing highs and lows, helping traders detect structural shifts in price action and potential trend changes.
A unique trading signal that uses RSI as the source for MACD calculation, providing a smoothed perspective on market trends and potential crossover confirmations.
A volume-centric trading indicator that analyzes market dynamics by tracking trapped trader positions and liquidity zones through dynamic VWAP segmentation.
Advanced technical analysis tool that decomposes price action into manipulation and distribution metrics, providing multi-dimensional insights into market behavior and potential trend changes.
A trading strategy that tracks green candle streaks, identifying key price levels for potential buy and sell points during upward price movements with customizable thresholds.
Advanced MACD enhances traditional momentum analysis by tracking histogram movements, offering deeper insights into market dynamics through color-coded and dynamic tracking of trend strength.
An advanced market structure indicator that systematically analyzes price action, detects manipulation, calculates probabilistic trade setups, and classifies market conditions using sophisticated tracking algorithms.
A technical analysis tool combining SuperTrend and trailing stop loss to identify market trends, generate entry/exit signals, and manage risk dynamically based on price movement and volatility.
Advanced multi-timeframe trading indicator that combines EMA analysis, bar pattern detection, and customizable alerts to help traders identify market trends and potential trading opportunities.
A dynamic RSI-based trading signal that adapts to market conditions by using z-score filtering and multiple momentum components to identify trading opportunities.
Likes, views, and comments are historical TradingView snapshots. They describe attention, not trading performance.