Order Block Finder (Experimental)
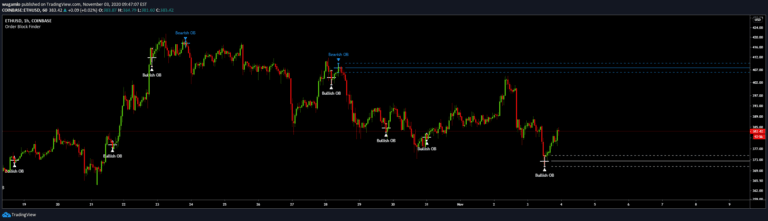
An indicator identifying institutional order blocks by detecting significant price zones where potential trend reversals or continuations might occur based on sequential candle patterns.
Explore 11,183 indicators. Filter beyond the obvious.
Discover the tools that fit the way you trade.
11,183 tools to explore
An indicator identifying institutional order blocks by detecting significant price zones where potential trend reversals or continuations might occur based on sequential candle patterns.
A liquidity indicator that highlights swing areas with trading activity, tracking price revisits, accumulated volume, and potential support/resistance zones using customizable filtering.
A volume-based indicator that identifies supply and demand zones on a chart, revealing potential support and resistance levels using precise volume and price analysis.
Fair Value Gaps (FVG) identify market imbalances between buyers and sellers, highlighting potential support and resistance levels where price movements might reverse or continue.
A technical analysis script that identifies cup-like price formations by creating channels and tracking potential breakout points in financial markets using specific bar search and channel width parameters.
A trading indicator that calculates volume delta and open interest delta, providing insights into market sentiment and trading activity across different price levels and asset types.
Renko Candles Overlay is a charting technique that transforms price action into uniform-sized bricks, offering a simplified visual representation of market trends and price movements.
A customizable moving average indicator that combines trend analysis with mean reversion detection, offering dynamic candle coloring and an oscillator to identify potential price shifts.
A candlestick pattern detection tool that identifies potential trend reversals using multiple pattern recognition techniques and stochastic oscillator filtering.
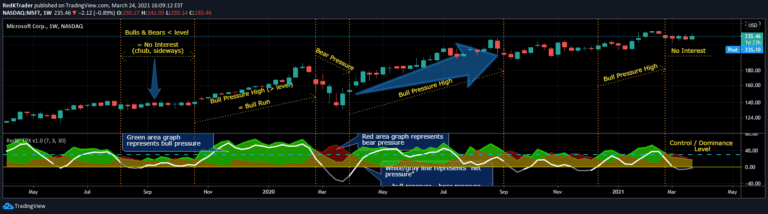
The RedK Trader Pressure Index (TPX) analyzes price bar changes to reveal the ongoing battle between bulls and bears, providing insights into market control and potential price action direction.
A trading indicator that identifies swing failure patterns by detecting price movements that exceed and then retreat from key swing levels, potentially signaling trend reversals.
A daily indicator identifying supply and demand areas using market data, highlighting potential support and resistance levels based on price and volume interactions.
Likes, views, and comments are historical TradingView snapshots. They describe attention, not trading performance.