YOUR INDICATOR RESEARCH STARTS HERE

Find the right indicator.
Understand what it does.

Explore 11,183 indicators. Filter beyond the obvious.
Discover the tools that fit the way you trade.

THE INDICATOR LIBRARY

Results for “time-based”

11,183 tools to explore

167 indicators matching your filters
Save search
VolumeEditor’s pick

Tick Chart

by LonesomeTheBlue

Tick Chart is a unique charting method that creates candlesticks based on a specific number of price ticks, offering an alternative to time-based charts for analyzing market movements.

Main price chart · unverifiedScalping · Day Trading
Explore
7.5Klikes149.3Kviews105comments
Save
LevelsSignalVolatility

ICT Killzones [LuxAlgo]

by LuxAlgo

A trading tool highlighting specific time-based market zones and Fibonacci retracements to identify optimal entry points across different forex trading sessions.

Main price chart · unverifiedScalping · Day Trading
Explore
4.5Klikes174.4Kviews31comments
Save
LevelsSignalVolume

RS: Market Profile

by inversionflow

A Market Profile indicator that visualizes price and volume distribution, highlighting key trading levels and providing insights into market structure through time-price opportunity (TPO) analysis.

Main price chart · unverifiedScalping · Day Trading
Explore
3.5Klikes54.6Kviews93comments
Save
VolumeTrendEditor’s pick

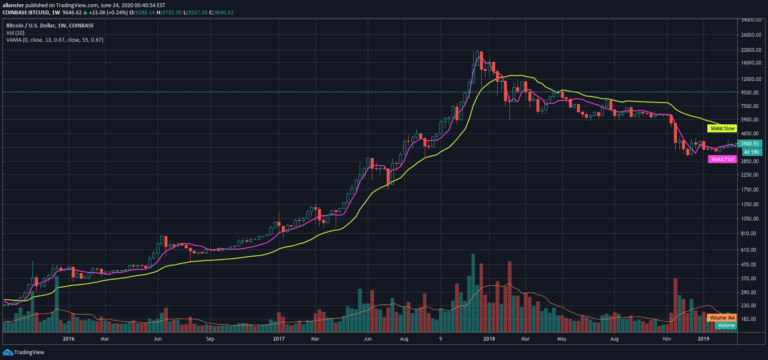
VAMA Volume Adjusted Moving Average Function

by allanster

Volume Adjusted Moving Average (VAMA) is an advanced indicator that calculates moving averages based on volume increments rather than traditional time-based methods, offering a unique perspective on price trends.

Main price chart · unverifiedDay Trading · Swing Trading
Explore
2.8Klikes64.8Kviews36comments
Save
MomentumSignalTrend

Line Break Chart Strategy

by LonesomeTheBlue

Line Break Chart Strategy is a Japanese chart style focusing on price movements without time intervals. It creates dynamic trend visualization through up and down lines based on price breaks.

Main price chart · unverifiedScalping · Day Trading
Explore
2.7Klikes46.6Kviews47comments
Save
LevelsSignal

DR/IDR Case Study [TFO]

by tradeforopp

A trading indicator designed to backtest the Defining Range (DR) concept, allowing traders to analyze session performance relative to predefined price ranges.

Main price chart · unverifiedScalping · Day Trading
Explore
1.6Klikes25.8Kviews17comments
Save
TrendMomentumEditor’s pick

Renko RSI

by LonesomeTheBlue

A Renko RSI tool that calculates momentum using custom Renko chart methodology, filtering price noise and focusing on significant price movements across different timeframes.

Separate pane · unverifiedDay Trading · Swing Trading
Explore
1.4Klikes39.6Kviews18comments
Save

Likes, views, and comments are historical TradingView snapshots. They describe attention, not trading performance.

START WITH A QUESTION

A little less searching.
A lot more understanding.

Tell DeepAlpha what you need. Get an explanation, a shortlist,
and a direct path to the indicators behind it.

Ask DeepAlpha