Heatmap Volume [xdecow]
A volume heat map indicator that colors volume bars and candles based on the standard deviation of trading volume from its average. Provides visual insights into volume intensity and potential market significance.
Explore 11,183 indicators. Filter beyond the obvious.
Discover the tools that fit the way you trade.
11,183 tools to explore
A volume heat map indicator that colors volume bars and candles based on the standard deviation of trading volume from its average. Provides visual insights into volume intensity and potential market significance.
A generalized Gaussian filter that smooths price data with variable pole orders, reducing noise and high-frequency market movements using advanced signal processing techniques.
A volume-based indicator that highlights key liquidity zones by detecting high-volume pivots and visualizing market activity through dynamic markers and support/resistance levels.
An advanced MACD variant that normalizes momentum measurements and uses Heikin-Ashi candles to provide smoother trend analysis across different assets and timeframes.
A multi-harmonic trigonometric model that extrapolates price trends using Fourier series and Quinn-Fernandes algorithm for predicting future price movements and cycles.
A neural network-enhanced RSI indicator that uses advanced smoothing techniques to generate precise trading signals across different market conditions and visualization modes.
A trend reversal probability indicator that uses custom oscillator calculations to estimate market direction shifts and potential trend changes with statistical probability analysis.
A Parabolic SAR-based indicator that identifies trends, tracks deviation levels, and provides volume insights for dynamic market analysis and potential trend reversals.
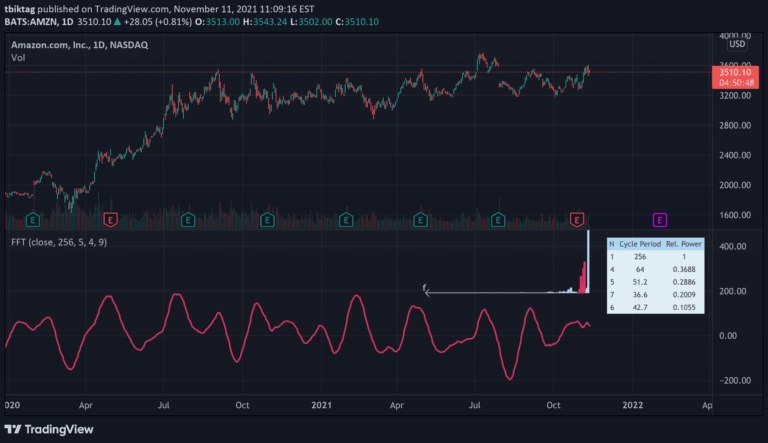
A Fast Fourier Transform (FFT) algorithm that decomposes time series data into cyclical frequency components, enabling advanced time series filtering and analysis.
A sophisticated technical indicator combining Z-Score and Heikin Ashi to analyze price movements, providing standardized volatility insights and trend identification.
Pro Scalper AI is a multi-faceted trading indicator that combines trend analysis, momentum, and AI forecasting to identify short-term trading opportunities with precision and reliability.
An advanced technical indicator combining Fourier Transform and Supertrend methodology to analyze market trends through dynamic frequency-based analysis and adaptive volatility control.
Likes, views, and comments are historical TradingView snapshots. They describe attention, not trading performance.