Standardized SuperTrend Oscillator
The Standardized SuperTrend Oscillator transforms the SuperTrend indicator into a dynamic tool for analyzing market trends, offering insights into potential reversals and mean reversion opportunities.
Explore 11,183 indicators. Filter beyond the obvious.
Discover the tools that fit the way you trade.
11,183 tools to explore
The Standardized SuperTrend Oscillator transforms the SuperTrend indicator into a dynamic tool for analyzing market trends, offering insights into potential reversals and mean reversion opportunities.
A neural network-enhanced RSI indicator that uses advanced smoothing techniques to generate precise trading signals across different market conditions and visualization modes.
Advanced machine learning trading strategy utilizing signal processing techniques and custom moving averages to generate precise housing market trading signals and performance metrics.
A hybrid indicator combining half-trend methodology with Heikin Ashi candles to detect market trends, reversals, and measure trend strength through advanced price analysis.
A sophisticated technical indicator combining Z-Score and Heikin Ashi to analyze price movements, providing standardized volatility insights and trend identification.
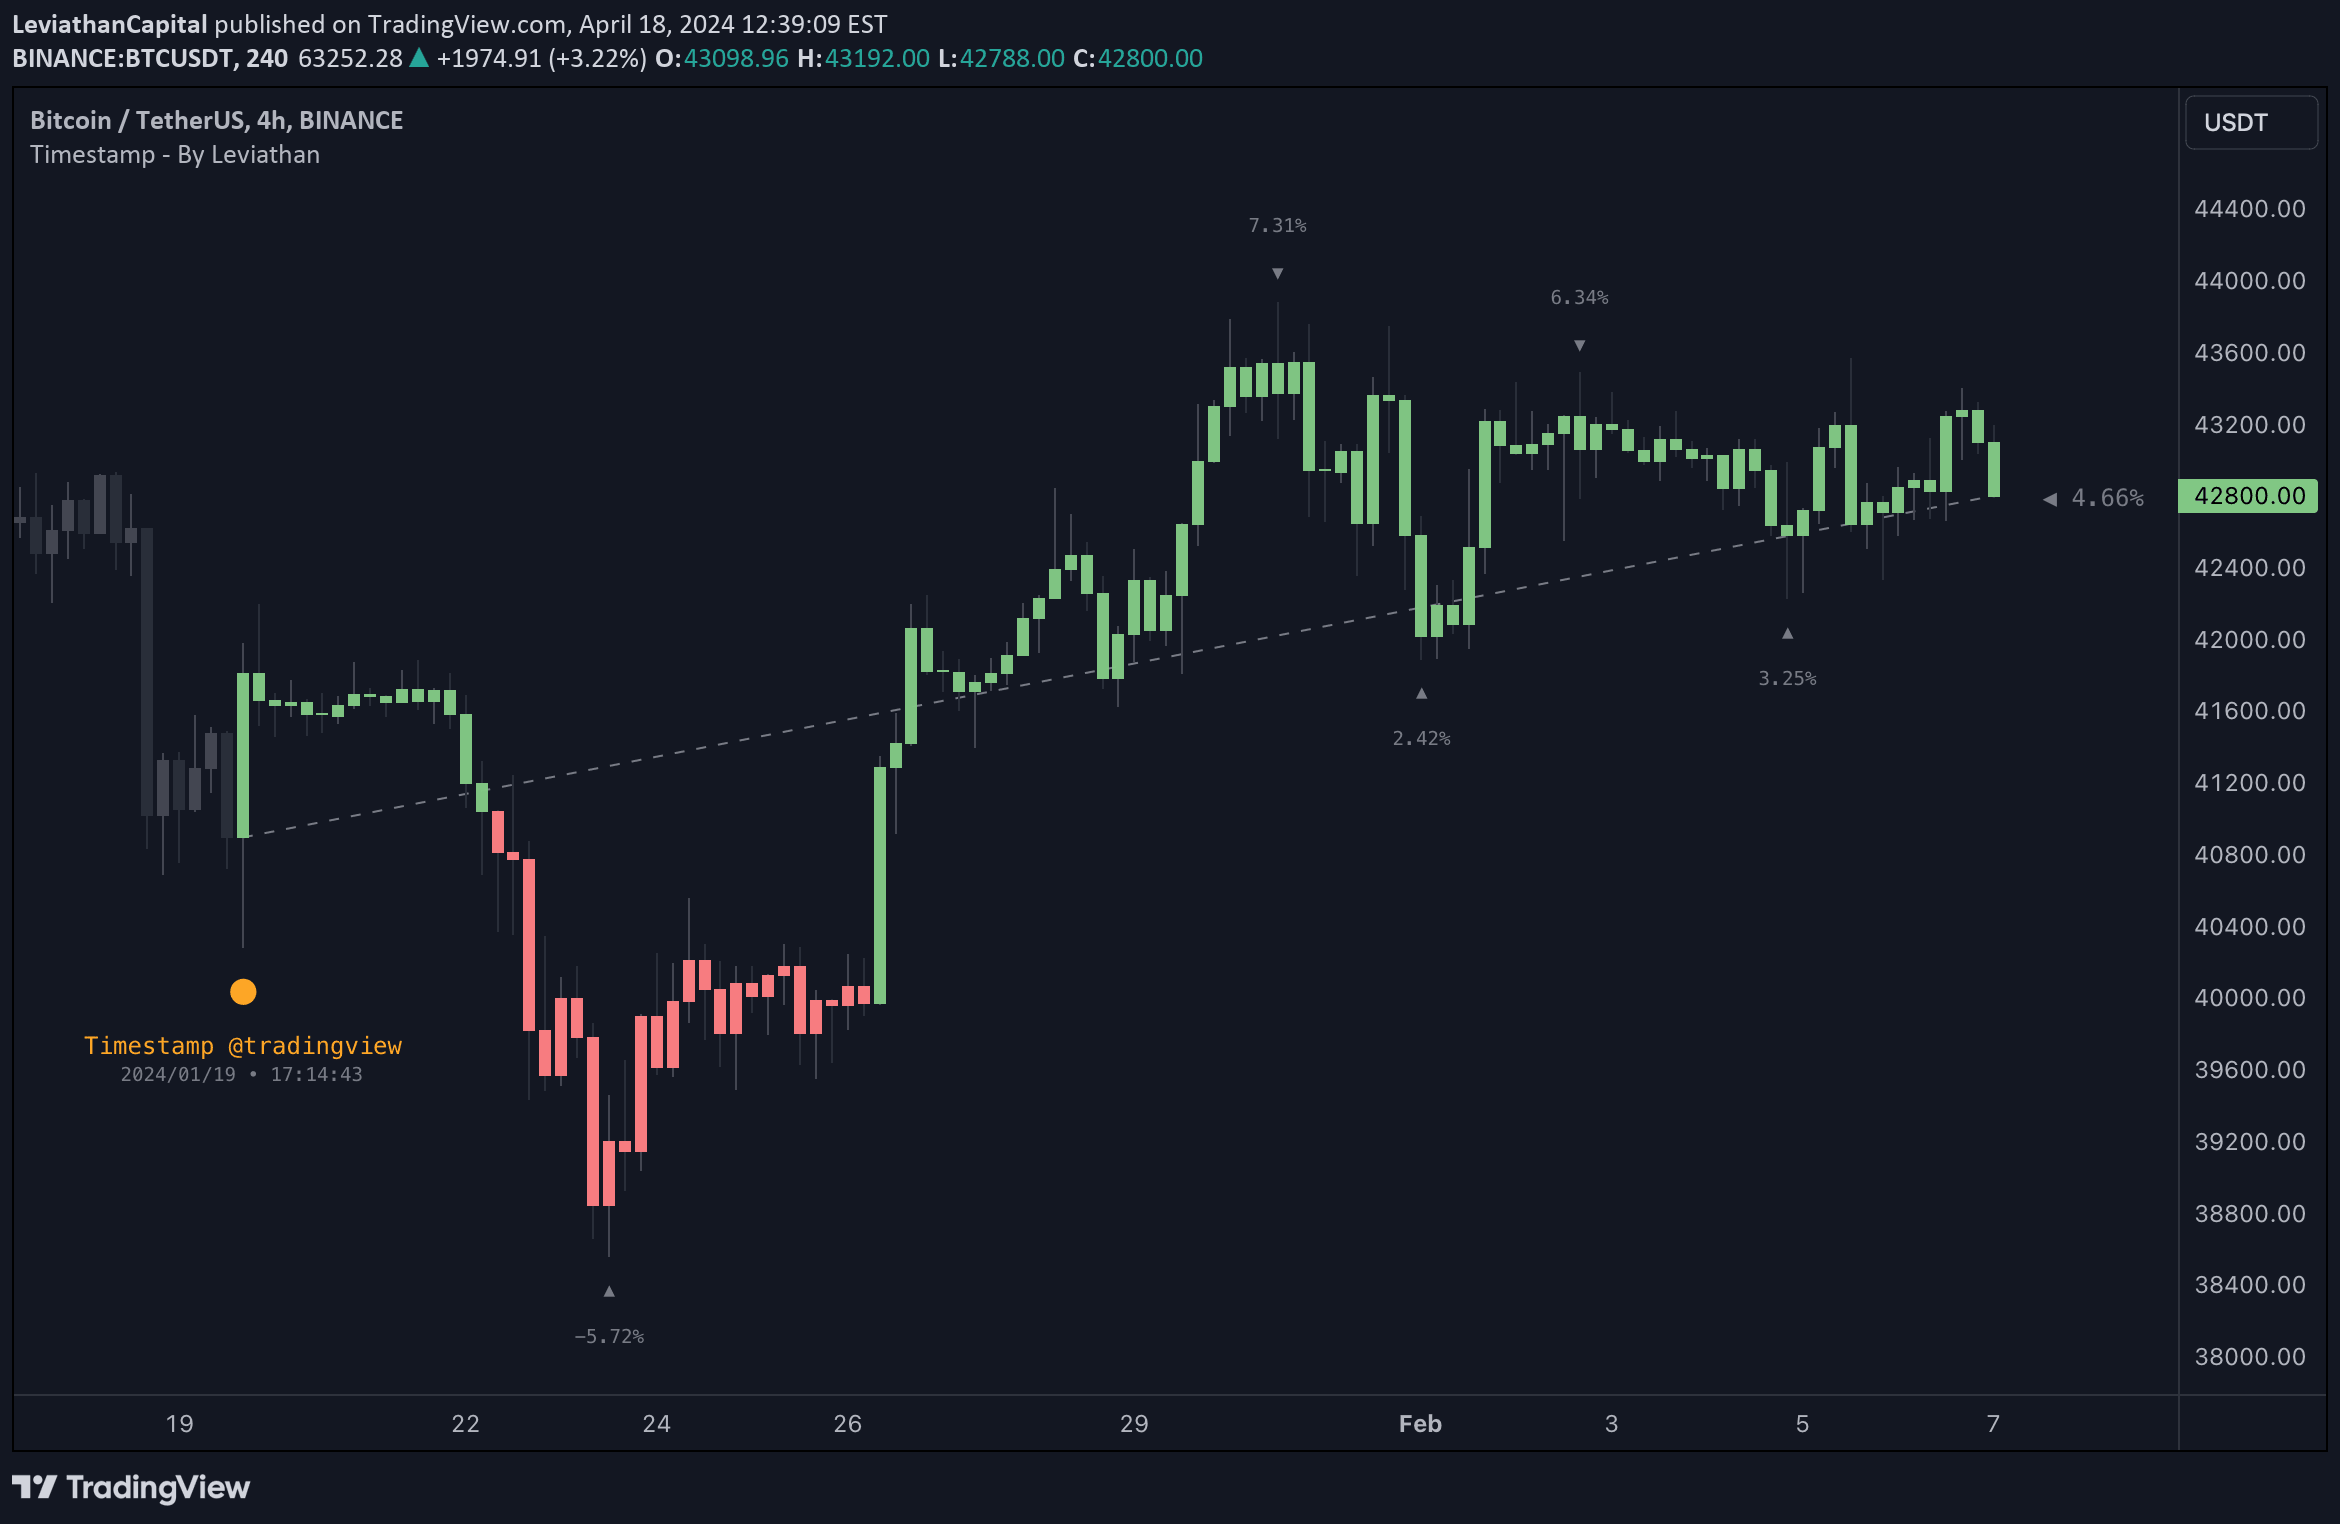
A tool for traders to generate visual timestamps of X/Twitter posts directly on trading charts, aligning social media content with market price actions and events.
The Stablecoin Supply Ratio Oscillator analyzes market sentiment by comparing Bitcoin's market cap to stablecoin market caps, using z-score transformation to identify potential market turning points.
A sophisticated technical analysis tool using hyperbolic tangent function to smooth price data and identify market trends with enhanced accuracy and reduced short-term volatility impact.
An advanced cycle period detector that analyzes market data spectral estimates to identify dominant cycles and frequencies in price action, providing insights into market rhythms and potential trend movements.
A unique trading indicator that calculates Triangularity over Stochastic RSI, providing enhanced insights into overbought and oversold market conditions with auto band levels.
A logarithmic regression curve for Bitcoin that color codes the price's deviation from its best-fit line, providing visual insight into trend dynamics and potential price extensions.
An adaptive SuperTrend Oscillator using K-Means clustering to dynamically analyze market volatility and identify trend shifts with precision and customizable visualization.
Likes, views, and comments are historical TradingView snapshots. They describe attention, not trading performance.