Order Blocks & Breaker Blocks [LuxAlgo]
Order Blocks & Breaker Blocks indicator identifies key price zones where significant trading activity occurred, highlighting potential future trading opportunities based on market structure.
Explore 11,183 indicators. Filter beyond the obvious.
Discover the tools that fit the way you trade.
11,183 tools to explore
Order Blocks & Breaker Blocks indicator identifies key price zones where significant trading activity occurred, highlighting potential future trading opportunities based on market structure.
HARSI is a unique oscillator combining Heikin Ashi candles with RSI calculations, designed to reduce noise and provide smoother trend analysis for traders.
Renko Candles Overlay is a charting technique that transforms price action into uniform-sized bricks, offering a simplified visual representation of market trends and price movements.
SwingArms is a color-coded trend indicator that visually confirms market trend changes using green and red signals for bullish and bearish movements respectively.
An advanced Open Interest indicator that provides comprehensive market insights through multiple visualization techniques and real-time statistical analysis of trading positions.
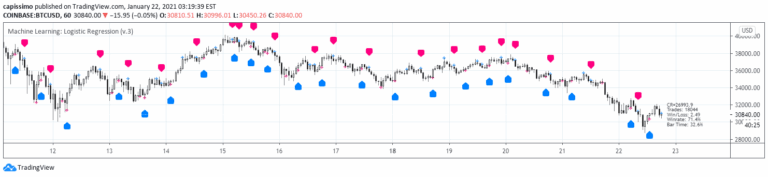
A machine learning strategy using logistic regression to classify market movements into binary categories by fitting a sigmoid curve to predict potential trading directions.
A pure price action indicator that detects order blocks and breaker blocks, identifying significant trading zones based on market structure and price movement patterns.
An indicator that identifies Fair Value Gaps and tracks price interactions, highlighting potential support and resistance zones based on price action and market energy.
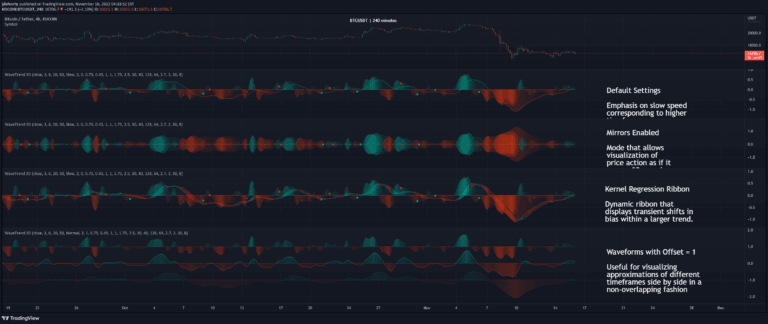
WaveTrend 3D is an advanced oscillator that uses digital signal processing and machine learning techniques to analyze price trends with enhanced precision and multi-timeframe support.
An advanced MACD variant that normalizes momentum measurements and uses Heikin-Ashi candles to provide smoother trend analysis across different assets and timeframes.
A Monte Carlo simulation tool that forecasts potential price ranges using complex pseudorandom generation techniques, providing probabilistic insights into market movement scenarios.
A custom trading tool that generates monthly and yearly performance tables for trading strategies, helping traders analyze historical strategy performance and identify key periods of success or weakness.
Likes, views, and comments are historical TradingView snapshots. They describe attention, not trading performance.