Rolling Risk-Adjusted Performance Ratios
A performance evaluation tool that calculates risk-adjusted return metrics like Sharpe, Sortino, and Omega Ratios to help traders assess investment performance and risk.
Explore 11,183 indicators. Filter beyond the obvious.
Discover the tools that fit the way you trade.
11,183 tools to explore
A performance evaluation tool that calculates risk-adjusted return metrics like Sharpe, Sortino, and Omega Ratios to help traders assess investment performance and risk.
A Pine Script indicator that compares financial metrics across multiple companies in the same sector, providing comprehensive insights into stock performance using key financial ratios and moving averages.
A fair value indicator that tracks central bank asset data from multiple countries to provide a comprehensive view of market valuation and potential trend direction.
A Bitcoin-specific price prediction indicator using Stock-to-Flow model that estimates expected price ranges by analyzing Bitcoin's supply dynamics and incorporating error bands.
A multi-security valuation index that helps traders identify overvalued and undervalued market conditions by comparing price ratios and calculating dynamic valuation levels across different securities.
CAPE ratio is a long-term valuation measure that smooths earnings over ten years, helping investors assess market valuations and identify potential investment opportunities.
Advanced technical analysis tool that decomposes price action into manipulation and distribution metrics, providing multi-dimensional insights into market behavior and potential trend changes.
A Bitcoin halving indicator that tracks and visualizes historical and upcoming Bitcoin halving events, providing traders with key dates and a real-time countdown to the next significant crypto milestone.
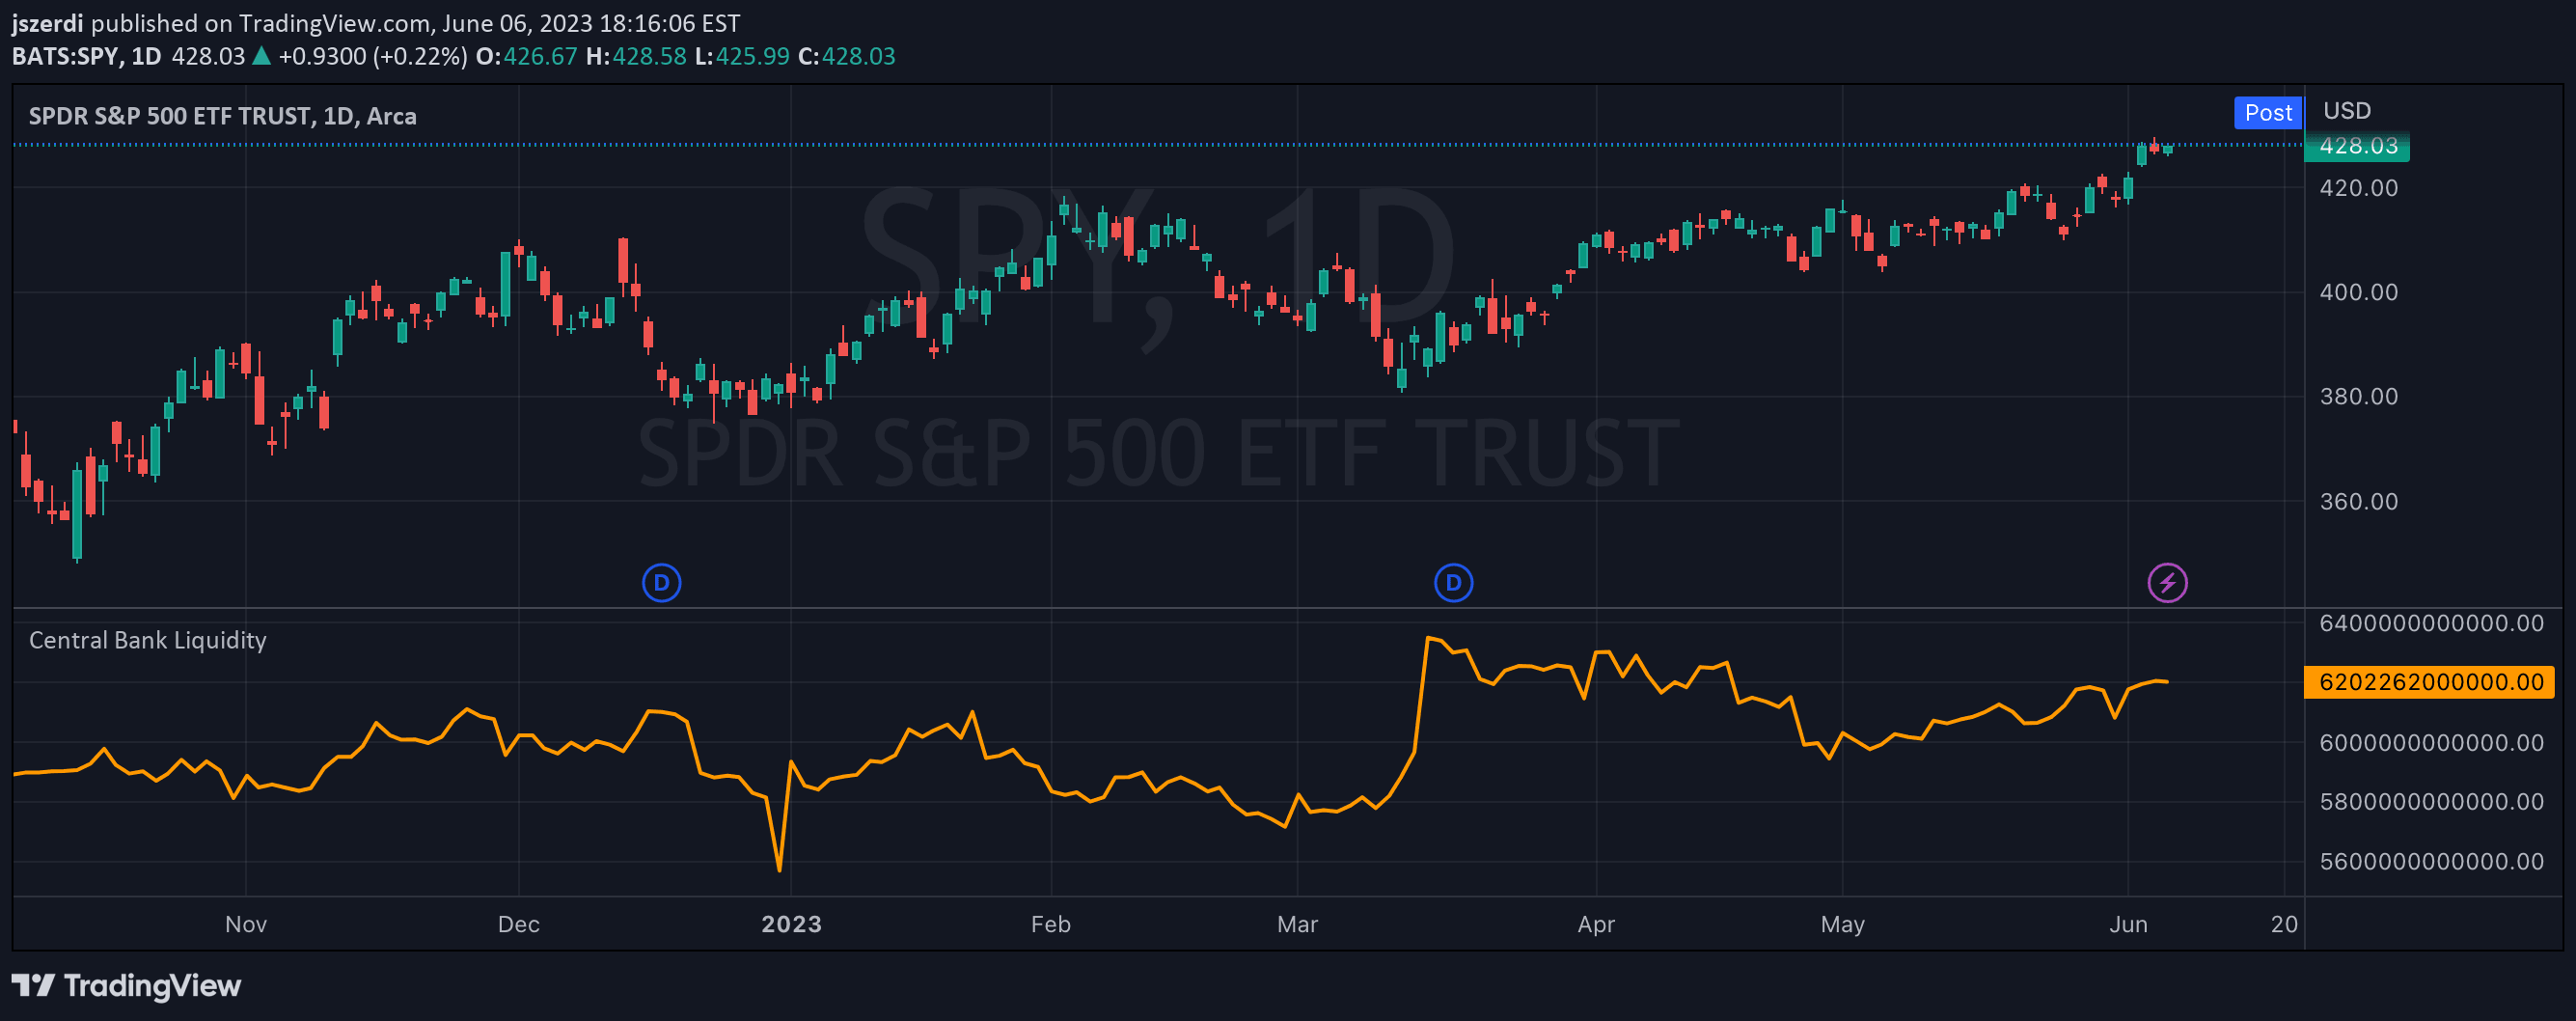
Central Bank Liquidity measures the Federal Reserve's total assets minus Treasury accounts and overnight agreements, providing insights into monetary policy and market liquidity.
A comprehensive financial ratio indicator for the S&P 500 that provides detailed insights into market valuation, earnings, and performance using multiple financial metrics.
A macro-economic indicator analyzing Bitcoin price divergence from M2 money supply, using normalized RSI to identify potential trading opportunities and market conditions.
A comprehensive multi-currency strength indicator that analyzes up to 19 currencies simultaneously, utilizing True Strength Index calculations to reveal real-time currency performance and market dynamics.
Likes, views, and comments are historical TradingView snapshots. They describe attention, not trading performance.