Order Block Finder (Experimental)
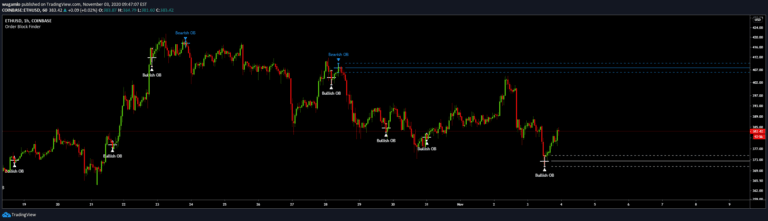
An indicator identifying institutional order blocks by detecting significant price zones where potential trend reversals or continuations might occur based on sequential candle patterns.
Explore 11,183 indicators. Filter beyond the obvious.
Discover the tools that fit the way you trade.
11,183 tools to explore
An indicator identifying institutional order blocks by detecting significant price zones where potential trend reversals or continuations might occur based on sequential candle patterns.
A volume-based indicator that identifies supply and demand zones on a chart, revealing potential support and resistance levels using precise volume and price analysis.
Advanced toolkit analyzing market structure and institutional investor behavior through interconnected indicators that reveal supply, demand, and potential price movement patterns.
A footprint bar indicator that visualizes volume or open interest data within the chart's visible range, offering three different heatmap styles to analyze trading activity.
A depth chart visualizing price liquidity by mapping bullish and bearish price variations, highlighting volume clusters and potential support/resistance zones across trading ranges.
A daily indicator identifying supply and demand areas using market data, highlighting potential support and resistance levels based on price and volume interactions.
A dynamic support/resistance indicator that classifies strength levels from 1-10 using higher time-frame data, helping traders identify key price zones across different timeframes.
A comprehensive market analysis tool tracking price frequency and trading volume to reveal market dynamics, support/resistance levels, and fair value zones.
Advanced volume profile indicator offering high-resolution analysis of trading volume across multiple range modes, providing traders with detailed insights into market structure and price-volume relationships.
A dynamic Volume-Weighted Average Price (VWAP) indicator that calculates on visible chart bars, offering traders a flexible way to analyze price movement and volume across different chart views.
A dynamic MACD-powered support and resistance mapping tool that generates structural levels based on momentum crossovers, helping traders identify potential market reversal and continuation zones.
On-Balance Volume (OBV) is a technical analysis tool that aggregates trading volume to measure buying and selling pressure, helping traders identify potential trend reversals and market momentum.
Likes, views, and comments are historical TradingView snapshots. They describe attention, not trading performance.