
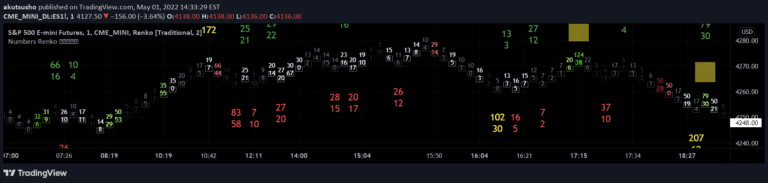
Numbers Renko
A Renko chart indicator that displays volume and time metrics within chart boxes, utilizing Wyckoff method principles to provide visual trading insights through color-coded numerical representations.
Explore 11,183 indicators. Filter beyond the obvious.
Discover the tools that fit the way you trade.
11,183 tools to explore
A Renko chart indicator that displays volume and time metrics within chart boxes, utilizing Wyckoff method principles to provide visual trading insights through color-coded numerical representations.
Weis Wave Volume identifies price waves and their volume, helping traders analyze market trends, detect reversals, and assess trend strength through volume-based analysis.
A trading method using wave analysis of price action and volume, developed by David Weis to identify market trends and strength through specialized wave measurement techniques.
A Bitcoin fair value indicator using global liquidity regression model that estimates intrinsic value by analyzing central bank liquidity metrics and price deviation.
A trading tool for identifying high and low price points within a specific time period, enabling traders to visualize and analyze price movements across multiple days.
A Glassnode on-chain metric that tracks profit or loss in cryptocurrency transactions, using Spent Output Profit Ratio (SOPR) and a normalized Z-Score to assess market sentiment.
A Detrended Price Oscillator that identifies market cycles by removing long-term trends and converting price deviations into a normalized Z-Score for easier interpretation of market extremes.
A fundamental analysis tool that evaluates Bitcoin network activity and price movements using Z-Score calculations to assess market interest and potential trend shifts.
A custom Z-Score indicator that measures price deviation from historical mean, scaling values between -2 and +2 to help identify potential overbought or oversold market conditions.
A technical indicator analyzing Short Term Holder Market Value to Realized Value ratio, providing insights into Bitcoin market cycles and potential trading opportunities through normalized Z-Score.
The DXY Z-Score indicator measures the US Dollar Index's price relative to its recent average, helping traders identify potential overbought or oversold conditions in the dollar's value.
A VWAP Z-Score Oscillator that measures price deviation from the Volume Weighted Average Price, providing insights into market dynamics through standard deviation analysis.
Likes, views, and comments are historical TradingView snapshots. They describe attention, not trading performance.