YOUR INDICATOR RESEARCH STARTS HERE

Find the right indicator.
Understand what it does.

Explore 11,183 indicators. Filter beyond the obvious.
Discover the tools that fit the way you trade.

THE INDICATOR LIBRARY

Results for “widget”

11,183 tools to explore

10 indicators matching your filters
Save search
MomentumOscillatorTrend

Market Sentiment Technicals [LuxAlgo]

by LuxAlgo

A comprehensive market sentiment indicator that synthesizes multiple technical analysis techniques into a single value, providing insights into market direction, momentum, and potential trend reversals.

Separate pane · unverifiedScalping · Day Trading
Explore
6.9Klikes128.8Kviews43comments
Save
MomentumTrendVolatility

Multi-Chart Widget [LuxAlgo]

by LuxAlgo

A multi-chart analysis tool enabling traders to simultaneously view multiple financial instruments, technical indicators, and performance metrics across different timeframes.

Main price chart · unverifiedScalping · Day Trading
Explore
3.3Klikes46.1Kviews22comments
Save
SeasonalitySignalTrend

Seasonality Widget [LuxAlgo]

by LuxAlgo

A tool that visualizes seasonal price trends across different time granularities, allowing traders to analyze recurring market patterns and potential price movements.

Separate pane · unverifiedScalping · Day Trading
Explore
1.2Klikes21Kviews8comments
Save
TrendVolatilityEditor’s pick

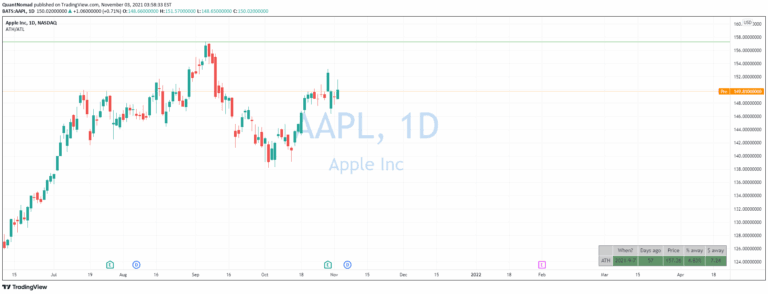
All-Time High/Low Widget

by QuantNomad

A widget that tracks all-time high and all-time low price levels, providing traders with insights into historical price extremes and potential breakout opportunities.

Main price chart · unverifiedDay Trading · Swing Trading
Explore
1Klikes45.4Kviews26comments
Save
TrendVolatilityEditor’s pick

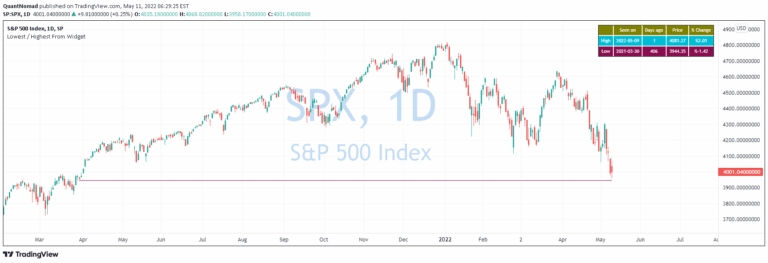
Lowest / Highest From Widget

by QuantNomad

A widget that identifies the most recent day when price was higher or lower than the current value, visualizing historical price comparisons through lines and informative tables.

Main price chart · unverifiedDay Trading · Swing Trading
Explore
815likes45.8Kviews12comments
Save
SignalTrend

US Treasuries Yield Curve

by QuantNomad

A widget tracking yield curve dynamics, allowing traders to compare current and historical yield curves and detect potential market inversions with a simple visual interface.

Separate pane · unverifiedSwing Trading
Explore
326likes5.9Kviews0comments
Save
Signal

BTC Pair Change %

by backslash-f

A trading tool that quickly displays the 24-hour price change percentage for a symbol's Bitcoin pair, providing instant market performance insights directly on the chart.

Main price chart · unverifiedScalping · Day Trading
Explore
52likes1.8Kviews0comments
Save
SignalVolatility

Candle Range Widget

by caasimdas

A trading signal that analyzes the range between the last and previous candle, helping traders measure stop loss levels and understand price movement dynamics.

Main price chart · unverifiedScalping · Day Trading
Explore
45likes2.9Kviews1comments
Save

Likes, views, and comments are historical TradingView snapshots. They describe attention, not trading performance.

START WITH A QUESTION

A little less searching.
A lot more understanding.

Tell DeepAlpha what you need. Get an explanation, a shortlist,
and a direct path to the indicators behind it.

Ask DeepAlpha