Supply and Demand Visible Range [LuxAlgo]
A volume-based indicator that identifies supply and demand zones on a chart, revealing potential support and resistance levels using precise volume and price analysis.
Explore 11,183 indicators. Filter beyond the obvious.
Discover the tools that fit the way you trade.
11,183 tools to explore
A volume-based indicator that identifies supply and demand zones on a chart, revealing potential support and resistance levels using precise volume and price analysis.
An advanced trading strategy measuring the opening range of a trading session to identify potential breakout opportunities and determine market trend direction with precise entry and exit points.
A dynamic range detection indicator that identifies price consolidation zones, highlights range extremities, and signals potential breakouts using real-time color-coded markers.
A trading indicator that uses pivot points to identify supply and demand zones, market structure, and potential trading opportunities through visual analysis of price action.
A technical analysis script that identifies cup-like price formations by creating channels and tracking potential breakout points in financial markets using specific bar search and channel width parameters.
An advanced trading indicator that detects instantaneously mitigated fair value gaps, providing signals based on rapid price corrections and market imbalances.
A predictive indicator that estimates future trading ranges by providing dynamic support and resistance levels while helping traders identify price trend directions in real-time.
A trading indicator that identifies swing point tests and retests, highlighting potential breakout areas with color-coded zones and triangular markers to signal market movement.
A multi-timeframe support and resistance indicator that identifies key price zones, tracks breaks and retests, and provides comprehensive market trend analysis for traders.
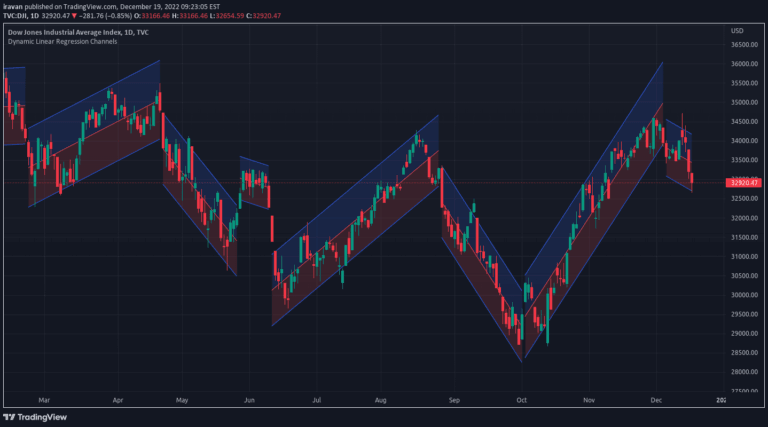
A dynamic linear regression channel indicator that adapts to price movements by creating new channels when previous channels break, helping traders identify trend changes and key price levels.
A trend-following indicator that analyzes moving averages through a channel method, measuring trend strength by comparing channel widths and providing visual cues about market direction.
A dynamic trend channel indicator that identifies market trends, projects future prices, and provides visual signals for potential trade opportunities using SMA and volatility calculations.
Likes, views, and comments are historical TradingView snapshots. They describe attention, not trading performance.