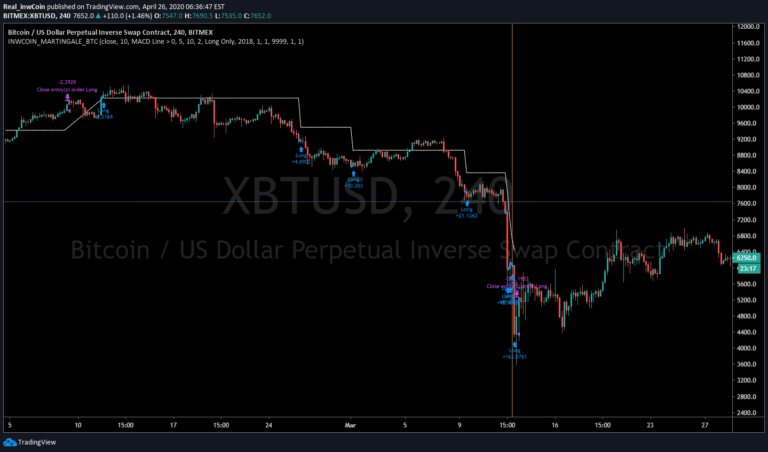
Grid Like Strategy
A grid trading strategy using martingale position sizing that doubles position size after losses, aiming to recover from previous trades by increasing exposure with each unsuccessful trade.
Explore 11,183 indicators. Filter beyond the obvious.
Discover the tools that fit the way you trade.
11,183 tools to explore
A grid trading strategy using martingale position sizing that doubles position size after losses, aiming to recover from previous trades by increasing exposure with each unsuccessful trade.
A risky trading strategy involving progressively doubling down on losing trades to recover losses, potentially generating high returns but with extreme portfolio risk.
A smart breakout indicator that identifies market opportunities using Change in Character and Break of Structure patterns with dynamic take profit and stop loss levels.
A TradingView binary options indicator using RSI crossovers to generate short-term trading signals on a 1-minute timeframe with performance tracking and statistics.
The Inamdar Wave is a dynamic market indicator that tracks momentum, generates precise buy/sell signals, and helps traders identify and ride profitable market waves across different asset classes.
A statistical trading indicator that quantifies the probability of reaching target prices using normal distribution analysis, helping traders assess market risks and potential outcomes.
A trading tool that visualizes past trading opportunities by highlighting potential winning locations for bracket trades using color-coded indicators on price charts.
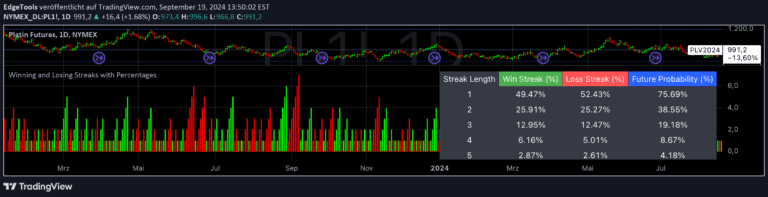
A Pine Script indicator that tracks and analyzes consecutive winning and losing streaks in financial data, providing insights into trend persistence and market behavior.
An advanced autocorrelation indicator that analyzes price movement patterns across multiple periods, helping traders identify potential trend continuations or reversals.
Likes, views, and comments are historical TradingView snapshots. They describe attention, not trading performance.