Machine Learning: Optimal RSI [YinYangAlgorithms]
An advanced RSI indicator that dynamically determines the most profitable RSI length through machine learning techniques, adapting to changing market conditions and optimizing trading signals.
Explore 11,183 indicators. Filter beyond the obvious.
Discover the tools that fit the way you trade.
11,183 tools to explore
An advanced RSI indicator that dynamically determines the most profitable RSI length through machine learning techniques, adapting to changing market conditions and optimizing trading signals.
A machine learning-powered trend line indicator that identifies unique support and resistance levels using advanced computational techniques, enhancing traditional technical analysis methods.
A machine learning-based standard deviation oscillator that helps traders identify market momentum, support and resistance levels, and potential overbought or oversold conditions.
A machine learning-based support and resistance indicator that dynamically predicts price levels using KNN algorithms, offering adaptive and predictive market zone identification.
An advanced momentum indicator using Rational Quadratics to analyze trend strength, visualize potential movement zones, and generate multiple momentum signals across different market conditions.
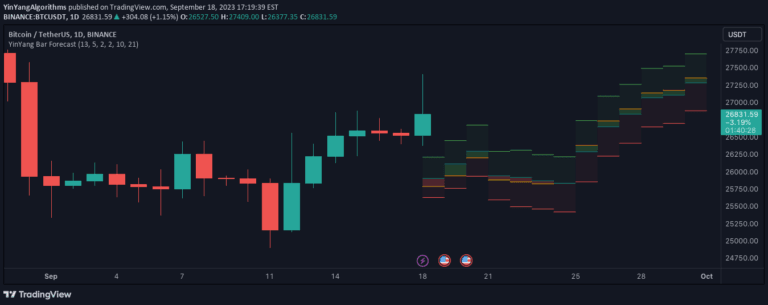
A predictive trading indicator that forecasts future bar movements by analyzing multiple technical indicators like volume, RSI, MFI, and moving averages to estimate potential price trajectories.
A trading indicator that creates upward and downward triangles to identify dynamic support and resistance levels based on price action and geometric ratios.
MFI Heat Map is a visual indicator using machine learning to analyze Money Flow Index across multiple lengths, providing insights into market momentum and potential trend changes.
An adaptive indicator that dynamically calculates optimal trading lengths for multiple traditional indicators, allowing for more flexible and responsive market analysis across different timeframes.
Likes, views, and comments are historical TradingView snapshots. They describe attention, not trading performance.