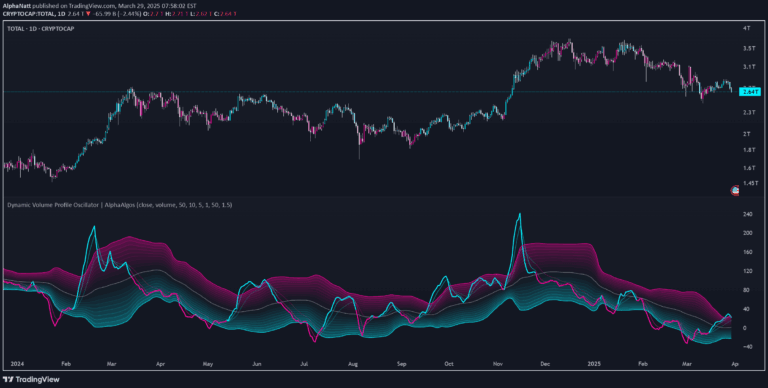
An advanced volume profile indicator that separates buying and selling volume across up to 10 custom trading ranges, providing detailed insights into market sentiment and trading dynamics.
Explore complementary indicator rolesHow it works
The 10x Bull Vs. Bear Volume Profile script generates detailed volume profiles by analyzing trading volume within configurable price ranges. It categorizes volume as bullish (green) or bearish (red), creating separate volume distributions that help traders understand market dynamics and sentiment.
The indicator calculates up to 2000 price levels per range, offering high-precision volume and delta analysis. It displays point of control (POC) and value area lines for both bull and bear profiles, allowing traders to visually interpret volume concentration and trading activity across different market conditions.
Why it may be useful
Volume profiles provide critical insights into market psychology by revealing where most trading activity occurs and the balance between buying and selling pressure. By separating bull and bear volumes, traders can more accurately assess market sentiment and potential price movements.
The granular approach of tracking volume at each price level helps traders identify key support and resistance zones, understand institutional trading behavior, and make more informed trading decisions based on volume distribution and market participation.
When to explore it
This volume profile indicator is most effective during intraday trading, particularly in liquid markets with significant trading volume. It works best for traders seeking to understand market dynamics, identify potential reversal points, and gauge the strength of price movements through volume analysis.
Traders can leverage this tool in volatile markets, during key trading sessions, and when looking to confirm trend strength or potential trend reversals. It is particularly useful for day traders and scalpers who need rapid, detailed insights into market sentiment and volume dynamics.
Keep exploring
What we’ve verified
Access, alerts and repainting behaviour have not been independently verified for this indicator. Check the creator’s current publication and settings.
General descriptions and classifications are recovered research. Verified details above identify the specific checks we have completed. Check the creator’s current publication for later changes.