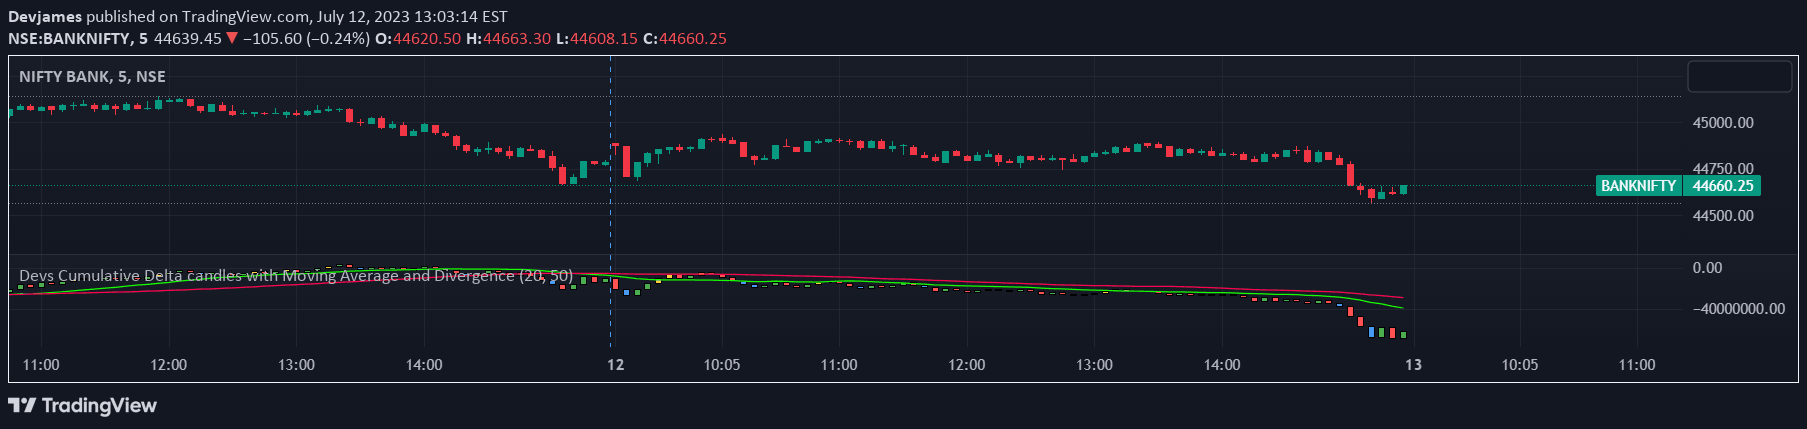
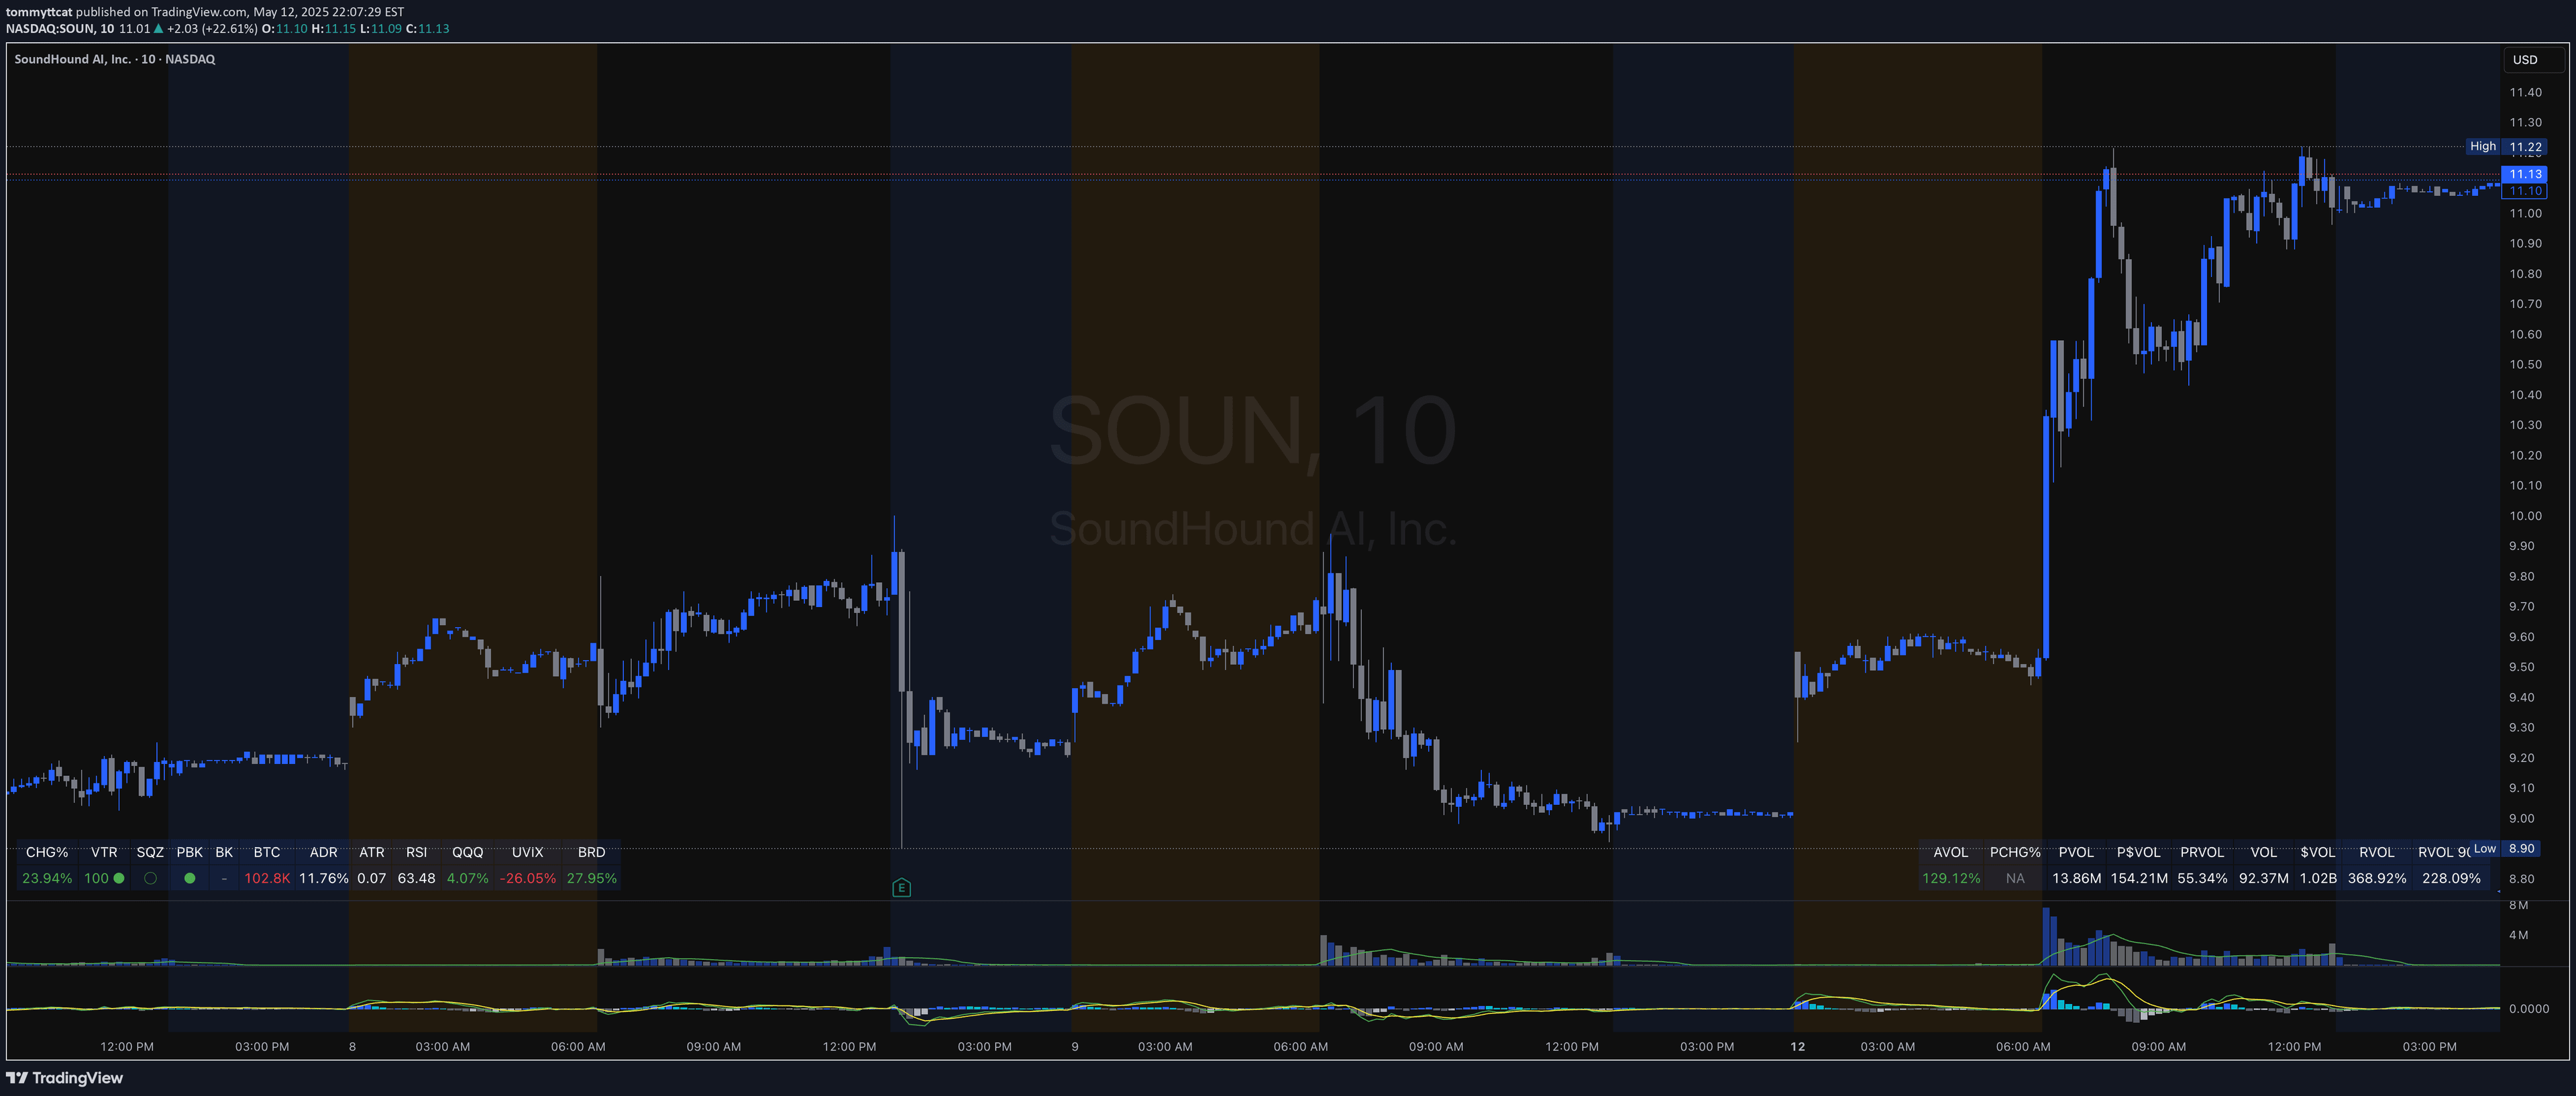
Cumulative Volume Delta indicator tracks buying and selling pressure over time, combining volume delta with a moving average to provide market trend insights and potential trading signals.
Explore complementary indicator rolesHow it works
The Cumulative Volume Delta (CVD) indicator calculates the difference between buying and selling volume over time, creating a cumulative line that shows market sentiment. It aggregates volume delta across multiple candles, providing a comprehensive view of buying and selling pressure beyond individual time frames.
By applying a moving average to this cumulative delta, traders can identify trend movements and potential reversal points. The indicator transforms raw volume data into a more interpretable format, allowing traders to see how buying and selling pressure evolve across different market conditions.
Why it may be useful
The CVD indicator offers traders a unique perspective on market dynamics by revealing the underlying buying and selling pressure that drives price movements. It helps traders understand market sentiment beyond price action, providing insights into potential trend continuations or reversals that might not be immediately apparent from price charts alone.
By combining the cumulative volume delta with a moving average, traders can detect more nuanced market signals and potential entry or exit points. The indicator is particularly valuable for identifying divergences between price and volume, which can signal potential market turning points or hidden market manipulation.
When to explore it
The Cumulative Volume Delta indicator works best in liquid markets with high trading volumes, such as major cryptocurrency pairs on spot exchanges like Binance. It is most effective on timeframes that provide sufficient volume data, allowing traders to observe meaningful cumulative volume trends and moving average interactions.
Traders should use this indicator in conjunction with other technical analysis tools, particularly when analyzing assets with consistent trading volumes and minimal leverage. It is especially useful for identifying potential trend continuation, reversal signals, and understanding the underlying market sentiment across different trading timeframes.
Keep exploring
What we’ve verified
Access, alerts and repainting behaviour have not been independently verified for this indicator. Check the creator’s current publication and settings.
General descriptions and classifications are recovered research. Verified details above identify the specific checks we have completed. Check the creator’s current publication for later changes.