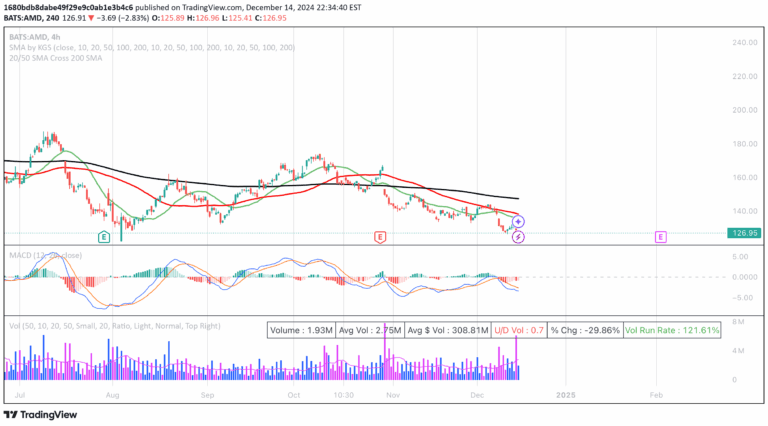
A custom indicator that colors candlesticks based on the relationship between price and two moving averages (9 and 21 periods), providing quick visual market sentiment insights.
Explore complementary indicator rolesHow it works
The indicator uses two simple moving averages (9-period and 21-period) to analyze price movement and market conditions. It applies specific color-coding to candlesticks based on the relationship between the current price and these moving averages.
Green candles indicate a bullish market when price is above the 9-period SMA and the 9 SMA is above the 21 SMA. Red candles signify a bearish market when price is below the 21-period SMA and the 9 SMA is below the 21 SMA. Yellow candles represent a sideways or neutral market when price and moving averages have specific positional relationships.
Why it may be useful
This indicator provides traders with an intuitive, visual method to quickly assess market sentiment and potential trading opportunities. By color-coding candlesticks, it simplifies the complex process of analyzing price movement and moving average relationships.
The visual approach allows traders to rapidly identify market conditions without extensive technical analysis. It helps traders make faster decisions by offering immediate insights into bullish, bearish, or neutral market states through an easy-to-understand color scheme.
When to explore it
The indicator is most effective in markets with clear trending or ranging characteristics, particularly for short to medium-term trading strategies. It works best on timeframes that allow clear visualization of moving average interactions, such as 5-minute to daily charts.
Traders should use this indicator alongside other technical analysis tools to confirm signals and reduce false positives. It is particularly useful for traders who prefer a quick, visual method of assessing market momentum and potential entry or exit points.
Keep exploring
What we’ve verified
Access, alerts and repainting behaviour have not been independently verified for this indicator. Check the creator’s current publication and settings.
General descriptions and classifications are recovered research. Verified details above identify the specific checks we have completed. Check the creator’s current publication for later changes.