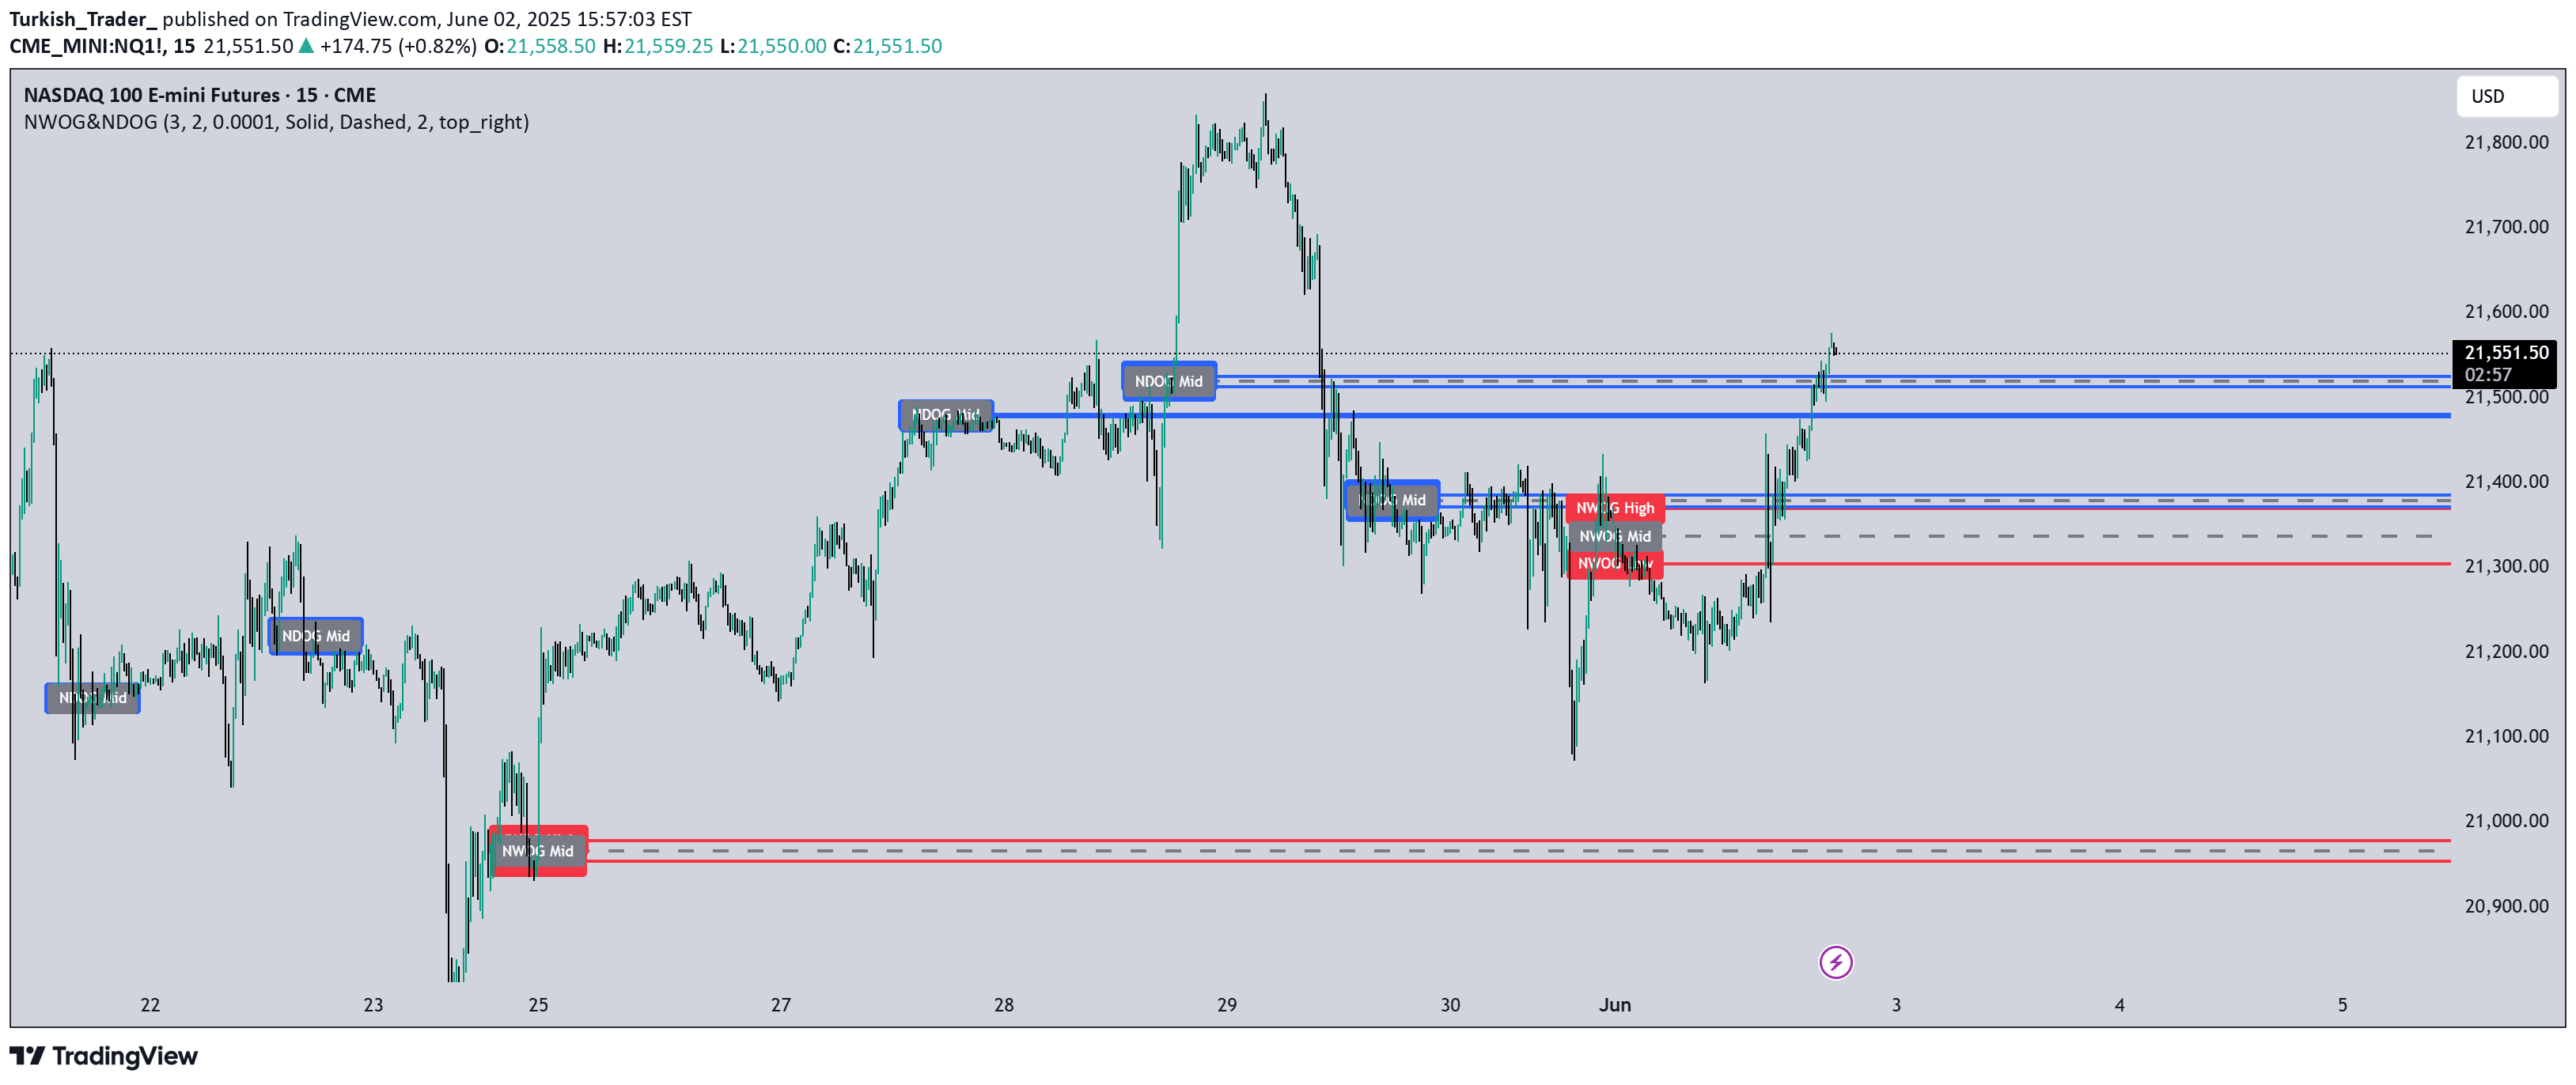
A trading indicator focusing on the 3AM EST candle, highlighting key support and resistance levels that can reveal potential market direction and trading opportunities.
Explore complementary indicator rolesHow it works
The 3AM EST Candle Range Theory Indicator automatically identifies and highlights the 3AM EST candle in blue, marking its high and low points with extended black lines across the chart. These lines represent critical support and resistance levels that can influence price movement throughout the trading session.
By tracking the interaction between current price action and these established lines, traders can observe potential breakouts, rejections, and trend confirmations. The indicator provides visual labels 'CRH' for the candle's high point and 'CRL' for its low point, making it easy to quickly recognize key price reference levels.
Why it may be useful
This indicator provides traders with a strategic framework for understanding intraday market dynamics by focusing on a critical time period that bridges European and U.S. trading sessions. By highlighting a specific candle's range, it offers insights into potential market sentiment and directional shifts that might otherwise be overlooked.
The visual representation of support and resistance levels allows traders to make more informed decisions about potential entry and exit points. It transforms abstract market information into clear, actionable visual cues that can enhance trading strategy across different market conditions.
When to explore it
The 3AM EST Candle Range Theory Indicator is most effective during active trading hours when both European and U.S. markets are operating. It works particularly well in markets with consistent 24-hour trading, such as Forex, where early morning sessions often demonstrate significant volatility and price movement.
Traders should focus on this indicator when seeking to understand short-term market sentiment, identify potential breakout opportunities, or establish intraday support and resistance levels. It is especially useful for day traders and scalpers looking to capitalize on quick market movements and precise entry/exit points.
Keep exploring
What we’ve verified
Access, alerts and repainting behaviour have not been independently verified for this indicator. Check the creator’s current publication and settings.
General descriptions and classifications are recovered research. Verified details above identify the specific checks we have completed. Check the creator’s current publication for later changes.