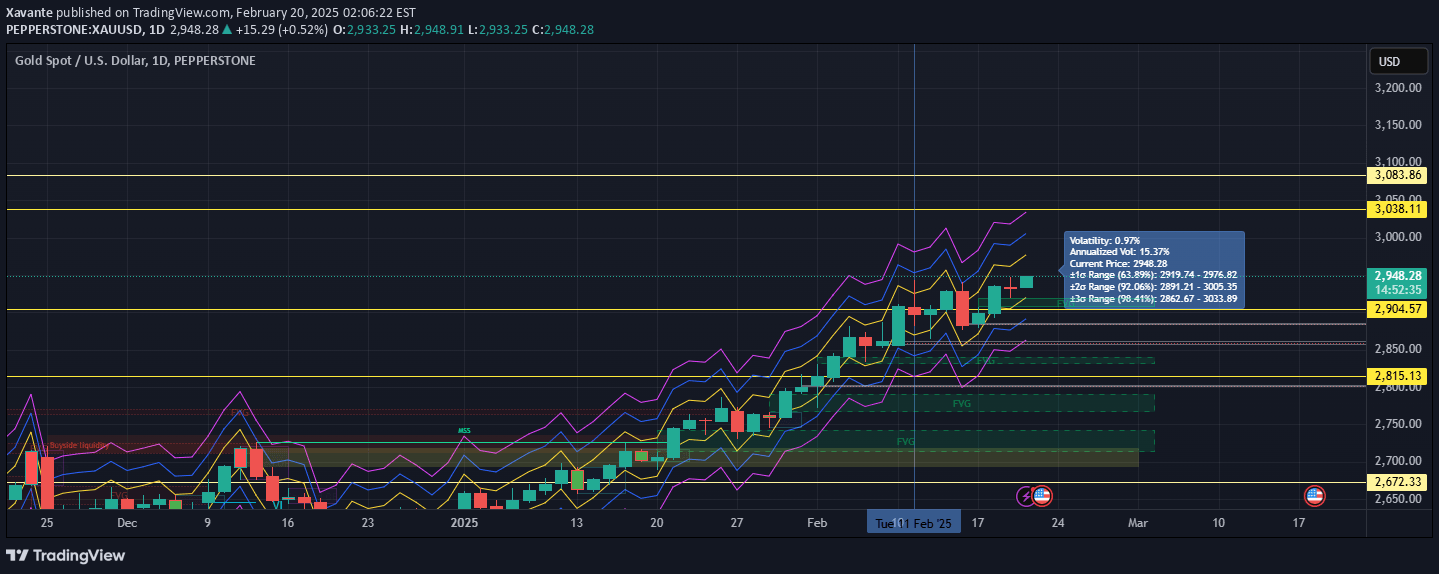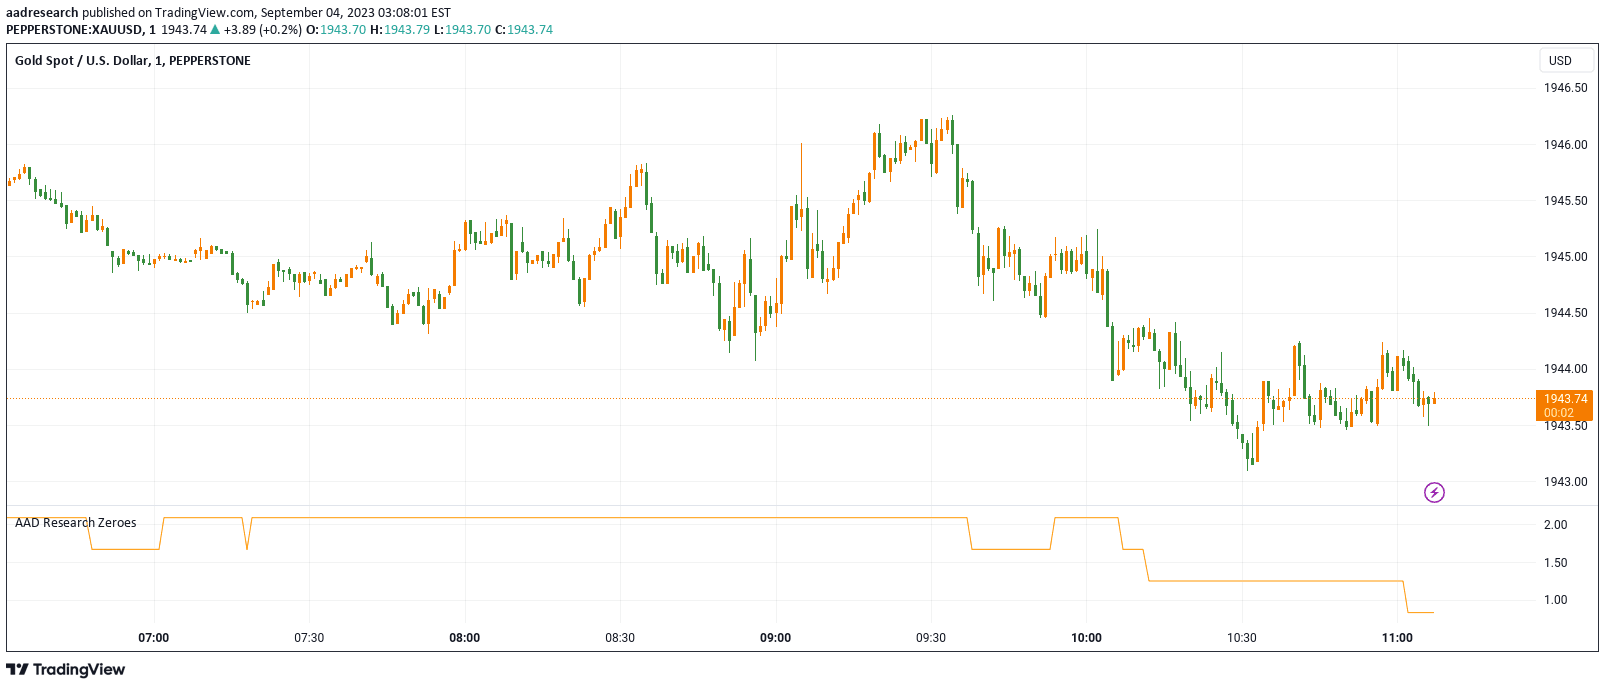
A trading signal that calculates zero candles within a specified period to measure market volatility, helping traders identify low-activity trading conditions.
Explore complementary indicator rolesHow it works
The zero candle signal tracks price movement within a specified timeframe, typically 4 hours, by identifying candles where the opening and closing prices are equal. By calculating the percentage of these zero candles, traders can assess the current market volatility and potential trading opportunities.
When more than 5% of candles in the chosen period are zero candles, it indicates low market activity and reduced price movement. This method provides a simple yet effective way to determine whether an asset is experiencing stable or stagnant market conditions.
Why it may be useful
Understanding market volatility is crucial for making informed trading decisions and managing risk effectively. By identifying periods of low market activity, traders can avoid entering trades during potentially unprofitable scenarios where price movement is minimal.
The zero candle signal helps prevent unnecessary trading during stagnant market conditions, potentially saving traders from entering positions with limited profit potential. It provides a straightforward method to quickly assess market dynamics and make more strategic trading choices.
When to explore it
The zero candle signal works best in day trading scenarios where short-term price movements are critical for making trading decisions. It is particularly useful in markets with varying volatility levels, such as cryptocurrency, forex, or highly liquid stock markets.
Traders should implement this signal as a supplementary tool alongside other technical analysis methods to confirm market conditions. It is most effective when combined with other volatility and trend indicators to create a comprehensive trading strategy.
Keep exploring
What we’ve verified
Access, alerts and repainting behaviour have not been independently verified for this indicator. Check the creator’s current publication and settings.
General descriptions and classifications are recovered research. Verified details above identify the specific checks we have completed. Check the creator’s current publication for later changes.