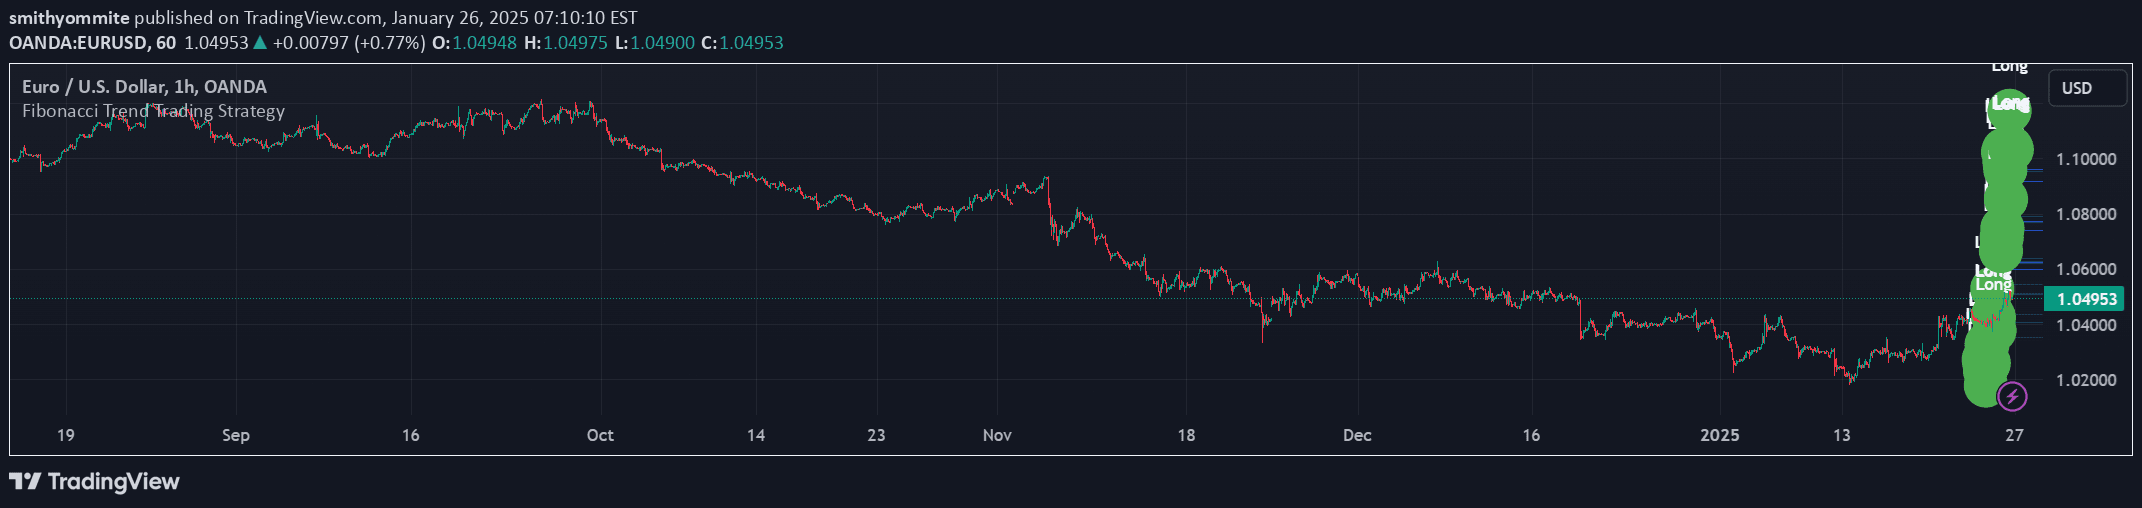
ABCD harmonic pattern identifies potential price reversal zones using precise Fibonacci ratios across four points A, B, C, and D in both bullish and bearish market conditions.
Explore complementary indicator rolesHow it works
The ABCD pattern uses four specific points to analyze potential market reversals through precise Fibonacci measurements. By tracking the relationships between points A, B, C, and D, traders can identify specific wave movements and potential trend changes using predetermined ratio ranges.
In a bullish pattern, the AB and CD waves move downward while the BC wave corrects upward, creating a potential reversal zone at point D. Conversely, in a bearish pattern, the AB and CD waves move upward with a downward BC wave correction, signaling a possible downward price movement at point D.
Why it may be useful
The ABCD harmonic pattern provides traders with a structured methodology for identifying potential market reversals with mathematical precision. By leveraging Fibonacci ratios, traders can develop more disciplined entry and exit strategies that minimize emotional decision-making and enhance technical analysis capabilities.
This pattern offers a systematic approach to understanding market dynamics across various financial instruments, including forex, stocks, and cryptocurrencies. Its ability to pinpoint potential reversal zones with specific ratio measurements makes it a valuable tool for traders seeking methodical and calculated trading strategies.
When to explore it
The ABCD pattern works best in markets with clear trending movements and sufficient price volatility that allows for distinct wave formations. Traders should prioritize using this pattern in liquid markets with regular price fluctuations, such as major currency pairs, prominent stock indices, and high-volume cryptocurrency markets.
Optimal application occurs when additional confirmation signals are present, such as supporting candlestick patterns, volume indicators, or other technical analysis tools that validate the potential reversal zone. Traders should combine the ABCD pattern with comprehensive market analysis to improve the probability of successful trades.
Keep exploring
What we’ve verified
Access, alerts and repainting behaviour have not been independently verified for this indicator. Check the creator’s current publication and settings.
General descriptions and classifications are recovered research. Verified details above identify the specific checks we have completed. Check the creator’s current publication for later changes.