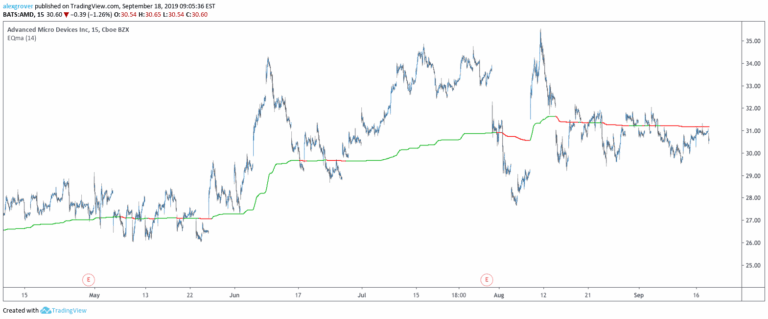
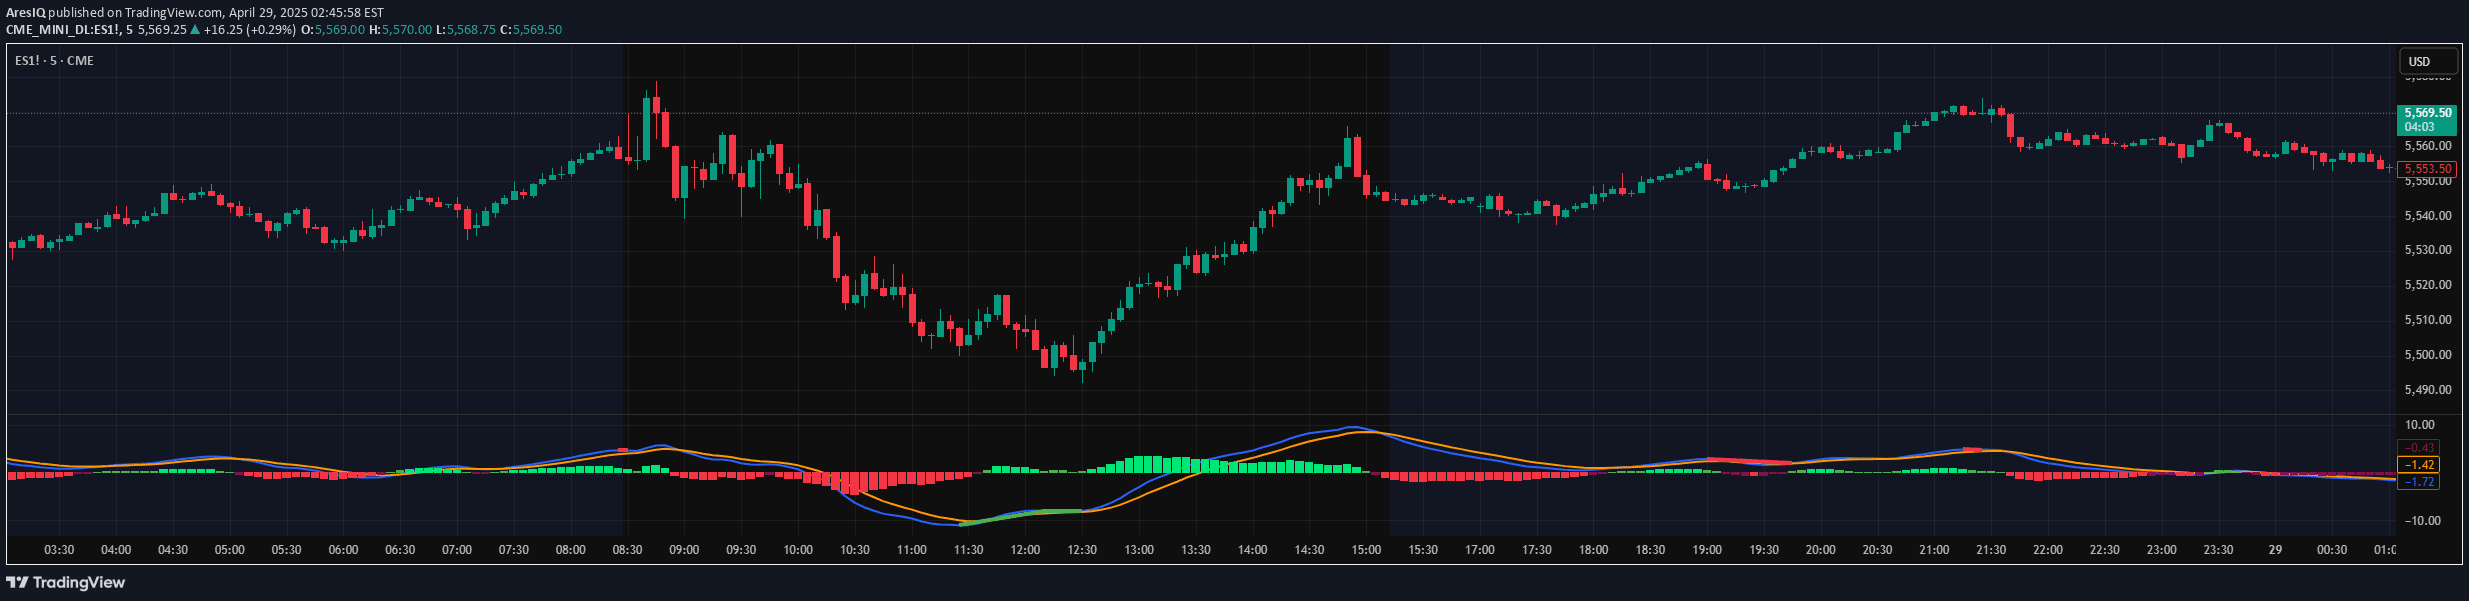
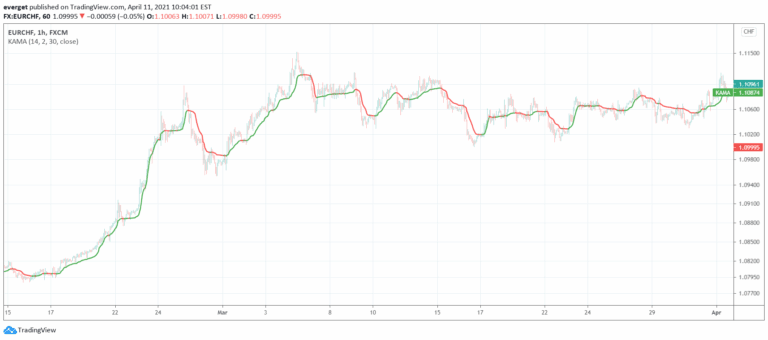
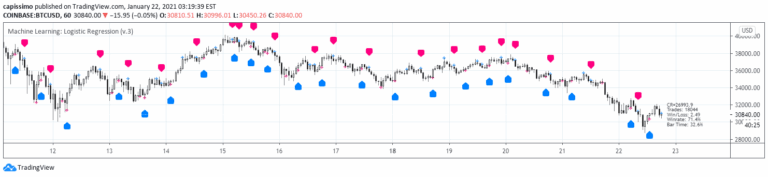
An adaptive EMA indicator that dynamically adjusts to market volatility, providing precise trend tracking and momentum analysis across different timeframes.
Explore complementary indicator rolesHow it works
The Adaptive Smooth EMA calculates multiple Exponential Moving Averages with lengths ranging from 3 to 90 periods, dynamically adjusting their phase based on current market volatility. It uses advanced smoothing techniques that modify the EMA calculation in real-time, allowing the indicator to respond more quickly to price changes.
By analyzing price data with adaptive algorithms, the indicator creates multiple smoothed lines that track market movement with enhanced precision. These lines are color-coded to represent different trend strengths and directions, providing traders with a visual representation of market momentum and potential trend shifts.
Why it may be useful
The Adaptive Smooth EMA provides traders with a more responsive and accurate trend analysis tool compared to traditional moving averages. By dynamically adjusting to market conditions, it reduces noise and false signals, helping traders make more informed decisions about market entry and exit points.
Its unique ability to adapt to different market volatilities makes it particularly valuable for traders seeking a comprehensive view of price movement. The indicator's color gradient system and multiple EMA lengths offer a nuanced understanding of market trends, enabling more strategic trading approaches across various market conditions.
When to explore it
The Adaptive Smooth EMA is most effective in markets with significant price movement and varying volatility levels. It performs exceptionally well in trending markets where clear directional momentum can be identified, helping traders capitalize on sustained price movements.
Traders should utilize this indicator when seeking to confirm trend strength, identify potential reversals, and optimize entry and exit strategies. It is particularly useful in volatile markets such as cryptocurrency, forex, and active stock trading environments where rapid price changes require sophisticated analytical tools.
Keep exploring
What we’ve verified
Access, alerts and repainting behaviour have not been independently verified for this indicator. Check the creator’s current publication and settings.
General descriptions and classifications are recovered research. Verified details above identify the specific checks we have completed. Check the creator’s current publication for later changes.