
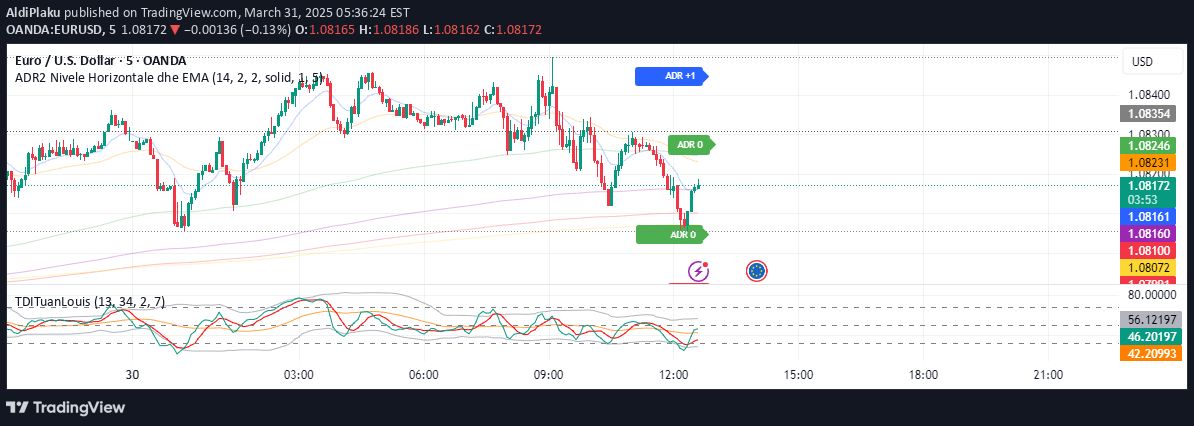
A Pine Script indicator combining Average Daily Range (ADR) levels with multiple Exponential Moving Averages (EMAs) to help traders identify potential price zones and trend dynamics.
Explore complementary indicator rolesHow it works
The indicator calculates the Average Daily Range (ADR) by computing the Simple Moving Average of daily price ranges over a specified period. It then creates horizontal lines above and below the mid-point of daily high and low prices. Multiple Exponential Moving Averages (EMAs) with different periods are plotted to show trend dynamics.
The ADR levels represent potential support and resistance zones, while the EMAs help traders understand short-term and long-term trend directions. The script uses Pine Script's line and label functions to visualize these levels and moving averages
Why it may be useful
This indicator provides traders with a comprehensive view of price dynamics by combining range-based levels and trend analysis. The ADR levels help identify potential price reversal or consolidation zones, offering insights into market volatility.
Multiple EMAs allow traders to understand trend strength and potential trend changes across different time horizons. By visualizing these levels and moving averages, traders can make more informed decisions about entry and exit points, potential trend reversals, and overall market sentiment
When to explore it
The indicator is most effective in markets with clear trending characteristics or during periods of consistent volatility. Traders can use it in stocks, forex, and cryptocurrency markets with sufficient liquidity. It works best on timeframes from 1-hour to daily charts, where ADR calculations provide meaningful insights.
Traders should combine this indicator with other technical and fundamental analysis tools for confirmation. It is particularly useful for swing traders and day traders looking to identify potential support and resistance levels and understand trend dynamics
Keep exploring
What we’ve verified
Access, alerts and repainting behaviour have not been independently verified for this indicator. Check the creator’s current publication and settings.
General descriptions and classifications are recovered research. Verified details above identify the specific checks we have completed. Check the creator’s current publication for later changes.


