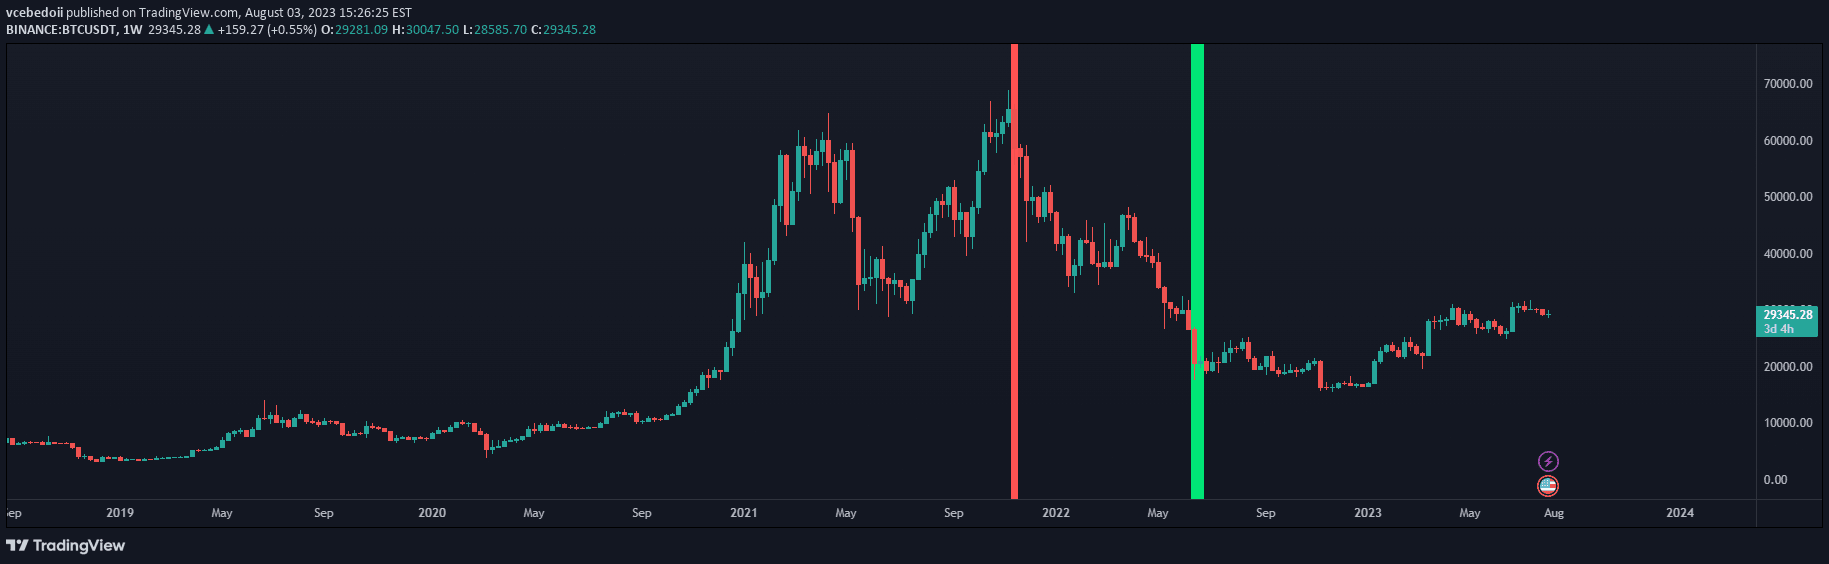
An advanced RSI indicator using moving average bands to dynamically identify overbought and oversold conditions, providing more precise market entry and exit signals.
Explore complementary indicator rolesHow it works
This indicator uses a standard 14-period RSI with an innovative approach to identifying market conditions. Instead of traditional static overbought and oversold lines, it incorporates a 70-period moving average band similar to Bollinger Bands, creating dynamic volatility boundaries.
By calculating standard deviation around the moving average, the indicator generates upper and lower bands that adapt to market changes. When the RSI crosses these bands, it signals potential trading opportunities, with the upper band suggesting overbought conditions and the lower band indicating oversold scenarios.
Why it may be useful
Traditional RSI indicators often provide limited insights with fixed thresholds, whereas this advanced version offers more nuanced and responsive market analysis. By adapting to changing market volatility, traders can receive more accurate signals about potential trend reversals and momentum shifts.
The color-coded background visualization helps traders quickly identify market conditions, making it easier to interpret complex price movements. This approach allows for more informed decision-making by providing a dynamic, context-aware interpretation of market momentum.
When to explore it
This indicator is most effective in markets with significant price fluctuations and clear momentum trends. It performs exceptionally well in forex, stock, and cryptocurrency markets where rapid price changes are common and precise entry/exit points are crucial.
Traders should combine this indicator with other technical analysis tools to confirm signals and reduce false positives. It is particularly useful during trending markets and can help identify potential trend reversals or continuation patterns across various timeframes.
Keep exploring
What we’ve verified
Access, alerts and repainting behaviour have not been independently verified for this indicator. Check the creator’s current publication and settings.
General descriptions and classifications are recovered research. Verified details above identify the specific checks we have completed. Check the creator’s current publication for later changes.