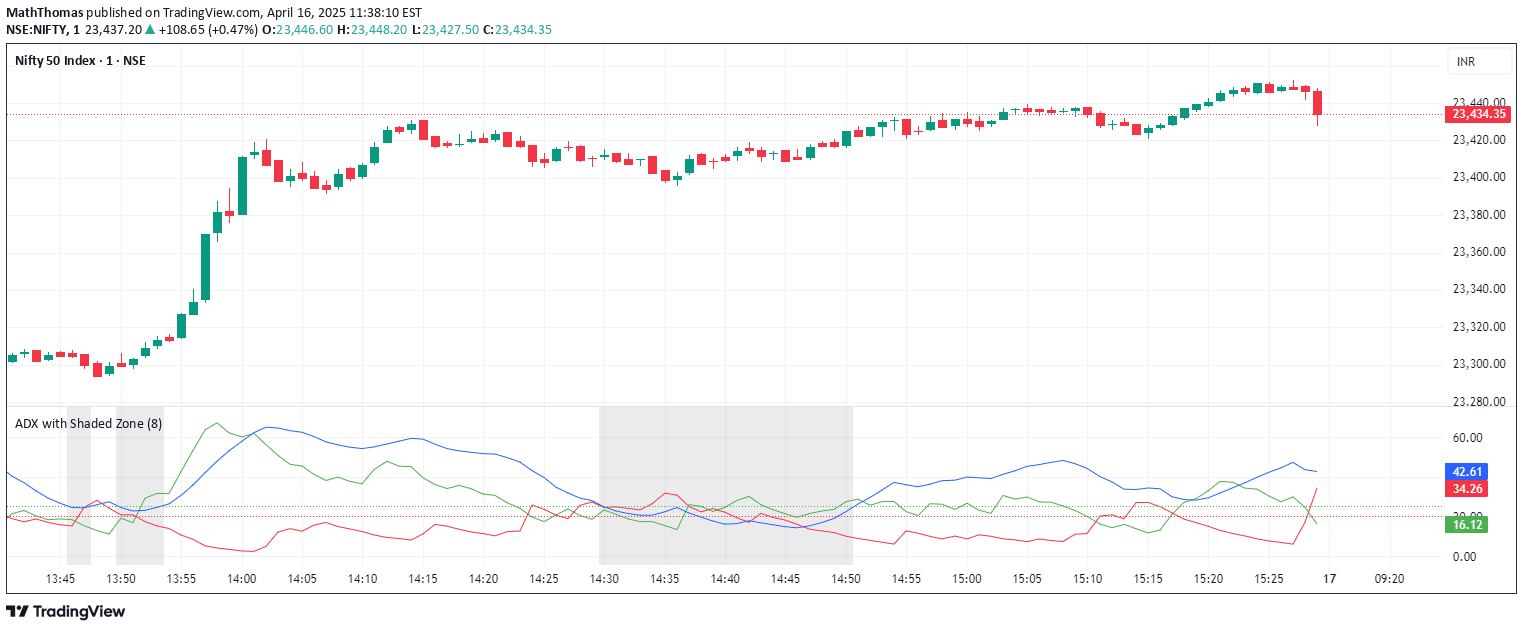
ADX and Directional Indicators help traders analyze trend strength and direction by measuring momentum and crossover signals in market movements.
Explore complementary indicator rolesHow it works
The Average Directional Index (ADX) calculates trend strength by comparing positive and negative directional indicators (DI+ and DI-). It uses the average true range to normalize directional movements and create a smoothed trend strength measurement. The calculation involves computing directional movements and then smoothing these values using a simple moving average.
The indicator generates buy and sell signals based on specific crossover conditions between DI+ and DI-. When DI+ crosses above DI- with an increasing smoothed difference, a buy signal is triggered. Conversely, when DI- crosses above DI+ with a decreasing smoothed difference, a sell signal is generated.
Why it may be useful
The ADX and Directional Indicators provide traders with critical insights into market trend dynamics by objectively measuring trend strength and potential directional changes. By quantifying momentum and trend intensity, traders can make more informed decisions about market entry and exit points. These indicators help differentiate between trending and ranging markets, reducing the likelihood of trading against the primary market direction.
The smoothed versions of the indicators further enhance signal reliability by reducing market noise and providing more stable trend assessments. Traders can use these measurements to validate other technical analysis tools and confirm potential trading strategies across different timeframes and market conditions.
When to explore it
The ADX and Directional Indicators are most effective in markets with clear trending characteristics, such as forex, commodities, and major stock indices. They work best when price is moving consistently in one direction, allowing the indicator to accurately measure trend strength and potential momentum shifts. Traders should pay special attention to crossover signals and ADX values above certain thresholds.
These indicators are particularly useful during periods of market volatility or when transitioning between ranging and trending market conditions. They can help traders identify potential trend reversals, confirm existing trends, and avoid false signals by providing a comprehensive view of market momentum and directional movement.
Keep exploring
What we’ve verified
Access, alerts and repainting behaviour have not been independently verified for this indicator. Check the creator’s current publication and settings.
General descriptions and classifications are recovered research. Verified details above identify the specific checks we have completed. Check the creator’s current publication for later changes.