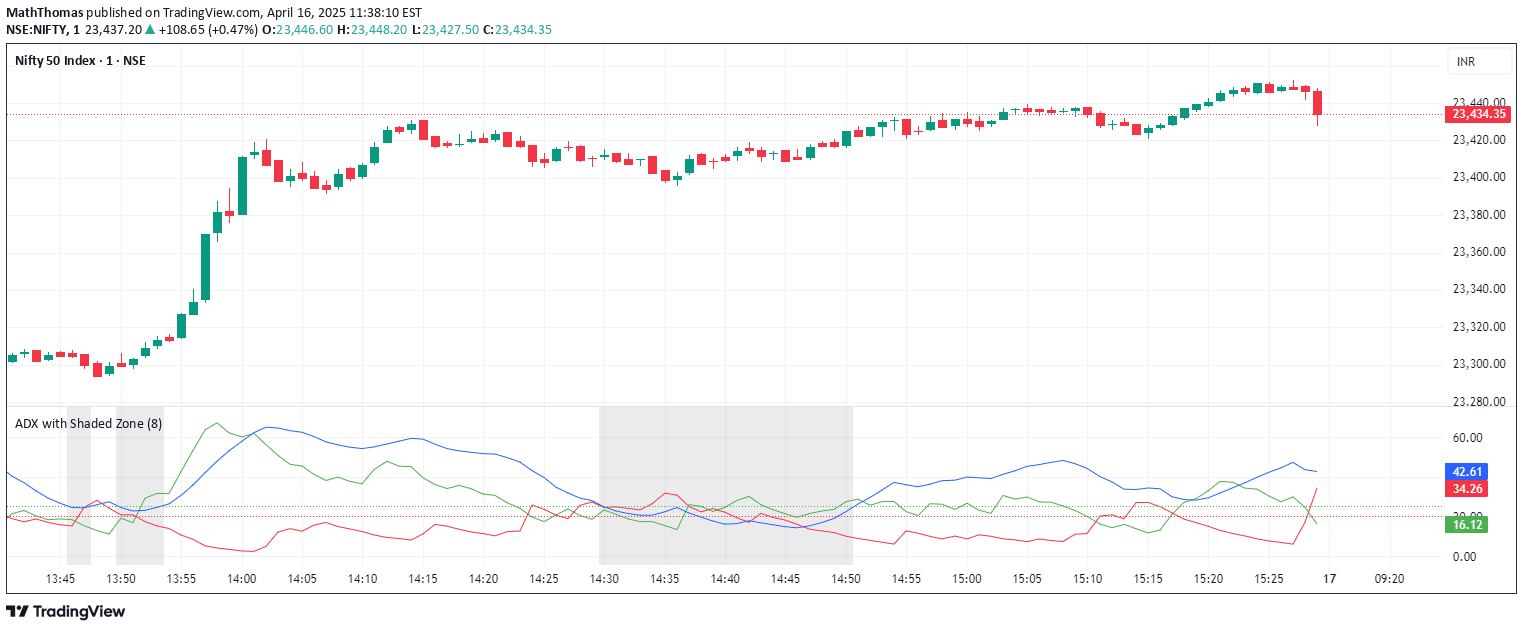
ADX measures trend strength by analyzing directional movement, helping traders identify strong market trends and potential trading opportunities across different market conditions.
Explore complementary indicator rolesHow it works
The ADX indicator calculates trend strength by comparing bullish (+DI) and bearish (-DI) directional movements. It uses a smoothing technique that normalizes price changes through True Range (TR) calculations, which helps eliminate short-term price fluctuations.
By applying a Relative Moving Average (RMA) to the difference between +DI and -DI, the indicator generates an ADX value that represents overall trend momentum. The resulting red line shows trend strength, while a blue horizontal line at 30 serves as a critical threshold for identifying significant market trends.
Why it may be useful
The ADX provides traders with a objective measure of trend strength, allowing them to distinguish between trending and non-trending market conditions. By quantifying momentum without specifying direction, it helps traders make more informed decisions about potential entry and exit points.
This indicator is particularly valuable because it cuts through market noise and offers a clear signal about the reliability of a current price movement. Traders can use the ADX to validate trading strategies, confirm trend-following signals, and avoid potentially risky trades during periods of low market momentum.
When to explore it
The ADX works best in markets experiencing clear directional movement, making it ideal for trend-following strategies across various financial instruments. It is most effective when the ADX value is above 30, indicating a strong trend that can support more confident trading decisions.
Traders should combine the ADX with other technical indicators like RSI or moving averages to confirm signals and reduce the risk of false trend identifications. It is particularly useful in markets with consistent price trends, such as forex, futures, and certain stock market sectors.
Keep exploring
What we’ve verified
Access, alerts and repainting behaviour have not been independently verified for this indicator. Check the creator’s current publication and settings.
General descriptions and classifications are recovered research. Verified details above identify the specific checks we have completed. Check the creator’s current publication for later changes.