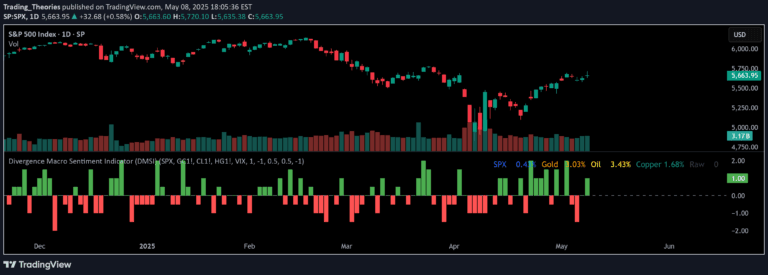
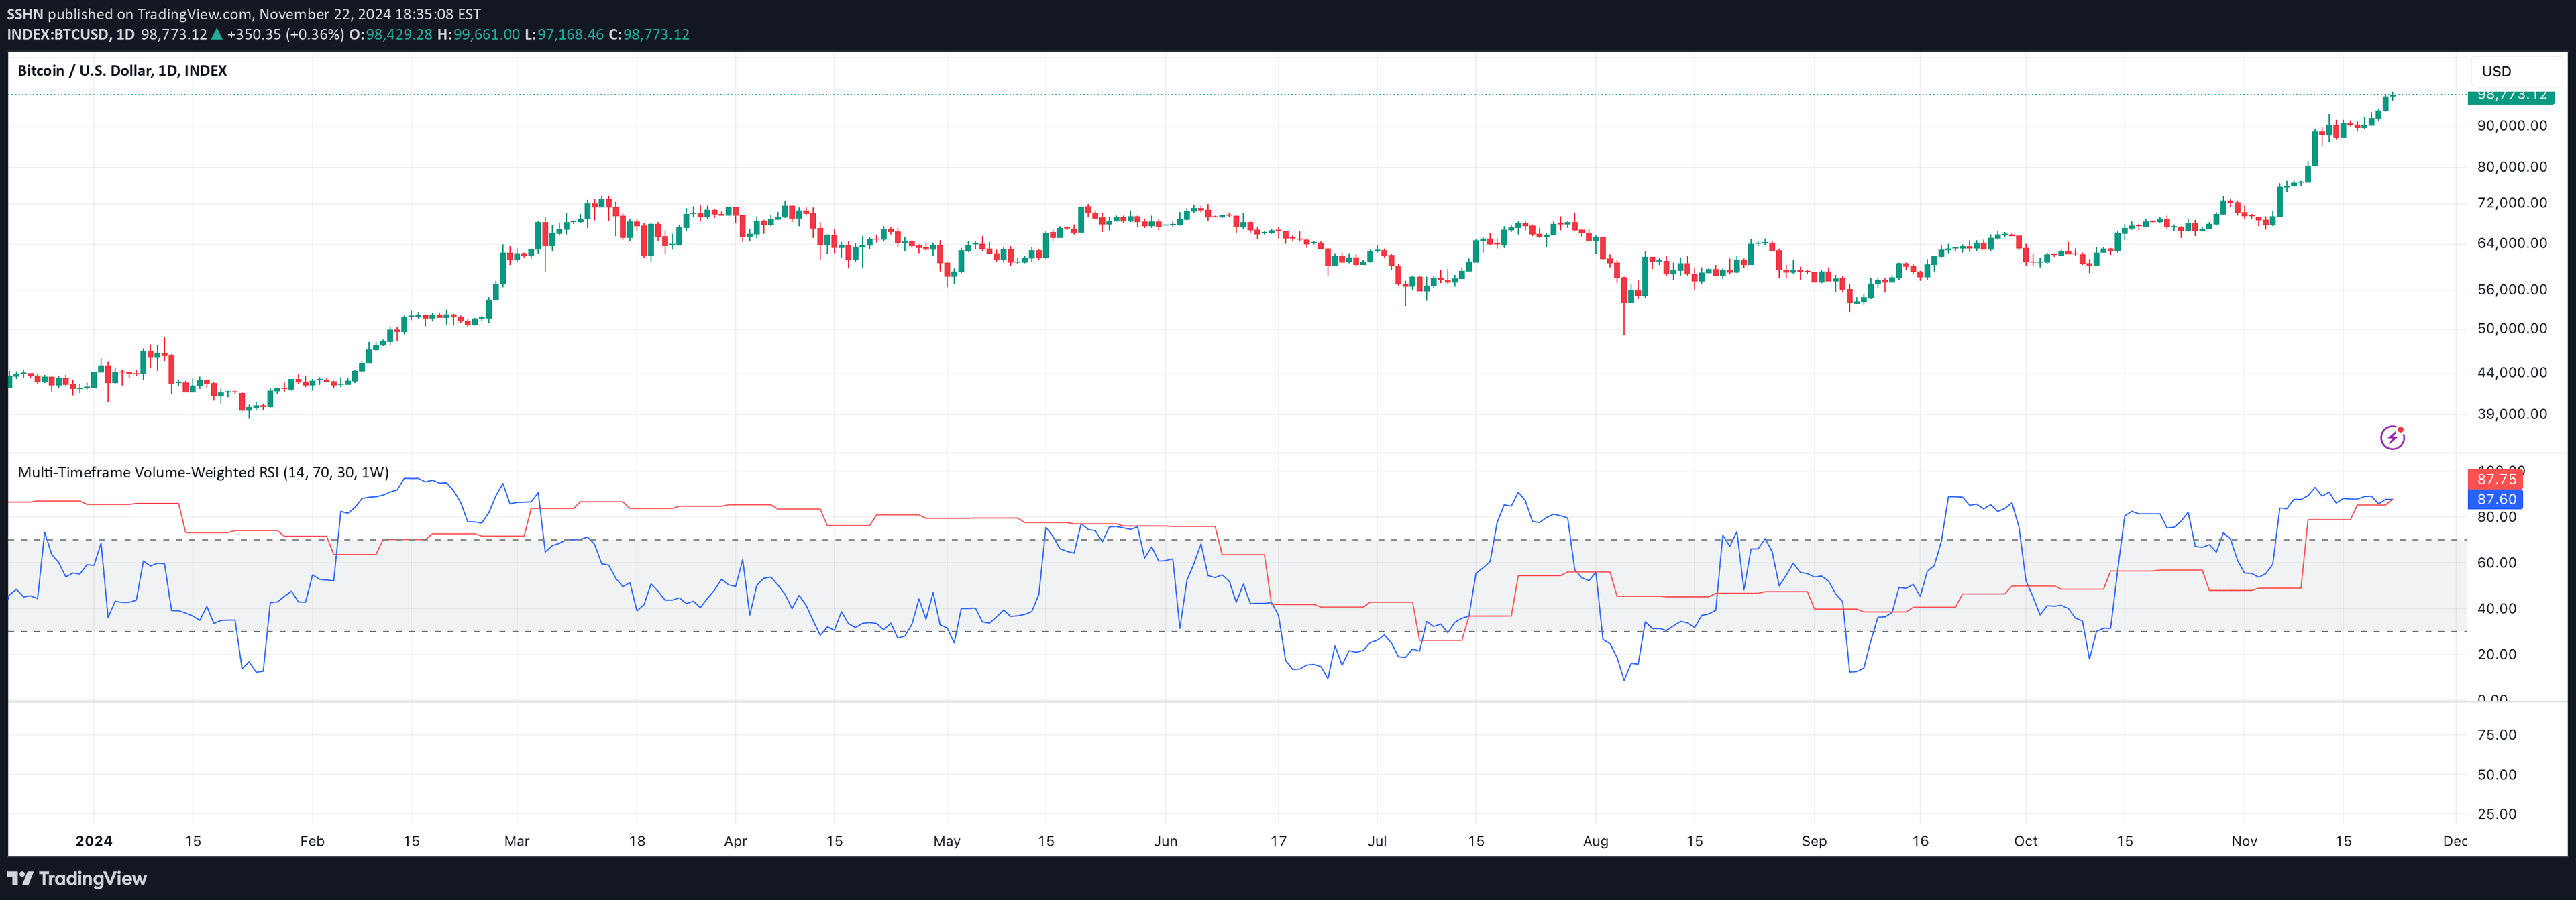
A multi-timeframe RSI indicator that aggregates momentum signals from different periods, providing a comprehensive view of market trend strength through color-coded signals and visual markers.
Explore complementary indicator rolesHow it works
The Dynamic RSI Indicator analyzes Relative Strength Index (RSI) signals across multiple timeframes including Weekly, Daily, 4-hour, 1-hour, and 30-minute intervals. It calculates momentum by aggregating RSI data using either dynamic correlation-based weights or equal weights.
The indicator generates a smoothed momentum line that changes color based on signal strength, ranging from dark green (strong buy) to dark red (strong sell). Large triangular markers appear at key momentum points to highlight potential trend reversals
Why it may be useful
This indicator provides traders with a more nuanced and comprehensive view of market momentum by combining signals from multiple timeframes. By integrating RSI data across different periods, it helps traders understand broader market trends and reduce the impact of short-term noise.
The color-coded system and visual markers make it easier to quickly interpret market conditions, potentially improving trade entry and exit decisions
When to explore it
The Dynamic RSI Indicator works best in markets with clear trend patterns and when traders want a holistic view of momentum across different time horizons. It is particularly useful for swing traders seeking to identify potential trend reversals and confirm market sentiment.
Traders should use this indicator in conjunction with other technical analysis tools and adjust its settings based on specific market conditions and trading strategies
Keep exploring
What we’ve verified
Access, alerts and repainting behaviour have not been independently verified for this indicator. Check the creator’s current publication and settings.
General descriptions and classifications are recovered research. Verified details above identify the specific checks we have completed. Check the creator’s current publication for later changes.