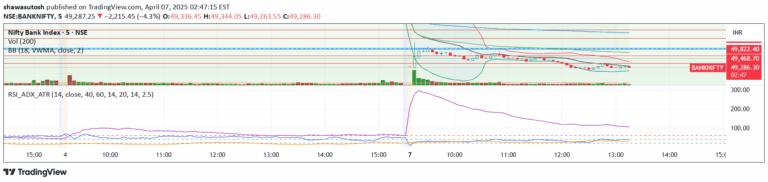
A comprehensive dashboard combining ATR, ADX, and RSI to provide quick insights into market volatility, trend strength, and momentum through color-coded indicators.
Explore complementary indicator rolesHow it works
The ATR, ADX & RSI Dashboard integrates three powerful technical indicators into a single, easy-to-read panel. Average True Range (ATR) measures market volatility by calculating the average price range over a specific period, with color-coded thresholds indicating low, moderate, or high volatility levels.
The Average Directional Index (ADX) assesses trend strength, while the Relative Strength Index (RSI) measures momentum by tracking price movement speed and potential overbought or oversold conditions. The indicators are color-coded to provide instant visual feedback: green for favorable conditions, orange for neutral, and red for potential warning signs.
Why it may be useful
This dashboard simplifies complex technical analysis by consolidating multiple indicators into a single, intuitive view. Traders can quickly assess market conditions without switching between different charts or calculations, saving time and reducing analytical complexity.
By providing color-coded insights, the dashboard helps traders make faster, more informed decisions about market entry and exit points. It offers a comprehensive snapshot of volatility, trend strength, and momentum, allowing traders to quickly understand the current market state and potential trading opportunities.
When to explore it
The ATR, ADX & RSI Dashboard is most effective during volatile market conditions or when traders need a quick, comprehensive market assessment. It is particularly useful for identifying potential trade setups across various timeframes, from scalping to swing trading.
Traders can use this tool to confirm trend strength before entering a trade, adjust risk management strategies based on volatility, and identify potential overbought or oversold conditions. The customizable settings allow adaptation to different trading styles and timeframes, making it a versatile tool for traders across various markets and experience levels.
Keep exploring
What we’ve verified
Access, alerts and repainting behaviour have not been independently verified for this indicator. Check the creator’s current publication and settings.
General descriptions and classifications are recovered research. Verified details above identify the specific checks we have completed. Check the creator’s current publication for later changes.