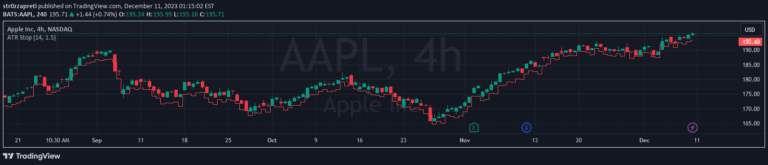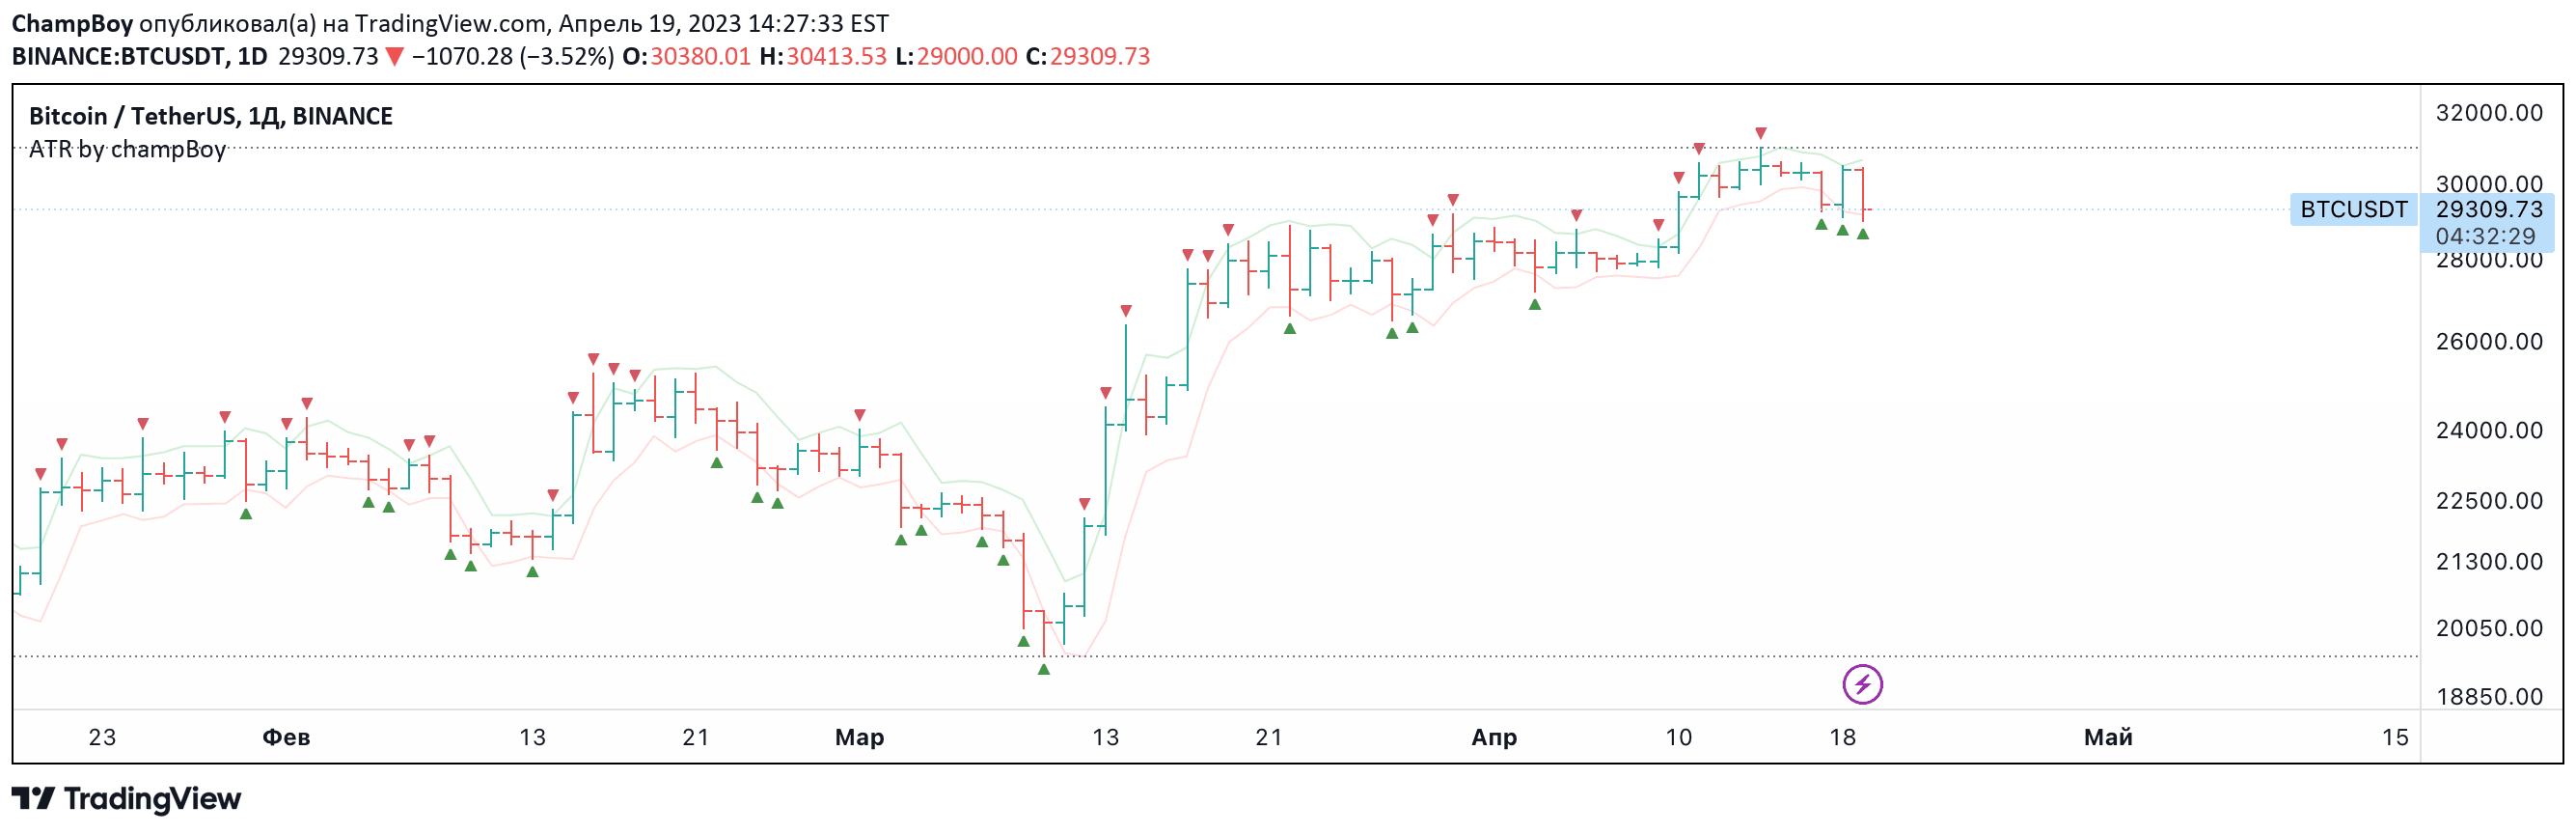
A trading indicator that analyzes candle volatility and provides error settings to detect potential price movement ranges and improve signal accuracy.
Explore complementary indicator rolesHow it works
The indicator calculates volatility by examining candle lengths and incorporating specific parameters like smooth length and data type. It uses candle close data and allows users to set parameters such as candle length, smooth length, and error settings to customize the analysis.
By filtering out extreme bars through percent high and percent low settings, the indicator helps reduce noise and focus on more meaningful price movements. The error setting enables traders to adjust the indicator's sensitivity and align it more closely with real market data.
Why it may be useful
This volatility indicator helps traders understand price movement dynamics by providing insights into market volatility and potential price ranges. It offers a flexible approach to analyzing price action, allowing customization based on individual trading strategies and market conditions.
By incorporating error settings and volatility filters, traders can gain a more nuanced view of market behavior. The indicator helps identify potential price movement reserves and detect periods of significant market activity, which can be crucial for making informed trading decisions.
When to explore it
The indicator is most effective during periods of moderate to high market volatility where price movements are not extreme. It works best for traders seeking to understand short-term price dynamics and identify potential trading opportunities based on candle volatility.
Traders should use this indicator in conjunction with other technical analysis tools to confirm signals and develop a comprehensive trading strategy. It is particularly useful for scalpers and day traders who need quick insights into market volatility and potential price movement ranges.
Keep exploring
What we’ve verified
Access, alerts and repainting behaviour have not been independently verified for this indicator. Check the creator’s current publication and settings.
General descriptions and classifications are recovered research. Verified details above identify the specific checks we have completed. Check the creator’s current publication for later changes.