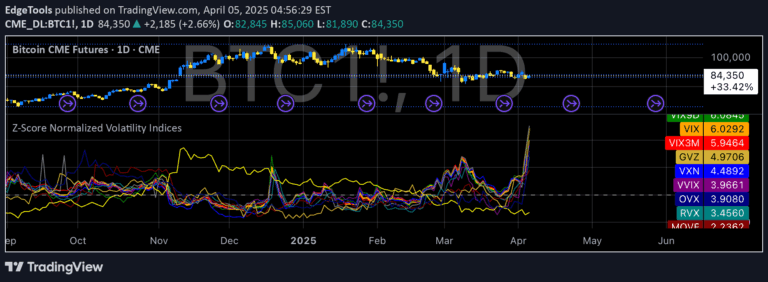
A custom volatility indicator that calculates three price ranges based on Daily Average True Range (ATR), providing quick visual insights into potential price movements across different timeframes.
Explore complementary indicator rolesHow it works
The indicator uses the Average True Range (ATR) with a standard 14-period setting to calculate three distinct volatility ranges: a 5-minute range at 3% ATR, a 1-hour range at 5% ATR, and a daily range at 10% ATR. These ranges are mathematically derived from the underlying price volatility, providing a dynamic representation of potential price movement across different timeframes.
By leveraging the ATR calculation, the indicator creates a standardized method of understanding price fluctuations. The ranges are displayed in a compact box, allowing traders to quickly assess the potential price movement and volatility without complex calculations or additional chart analysis.
Why it may be useful
Volatility is a critical component of trading strategy, as it helps traders understand potential price movement and manage risk effectively. This indicator simplifies complex volatility analysis by presenting clear, actionable ranges that can guide entry, exit, and stop-loss decisions across multiple trading styles and timeframes.
By providing instant visual insights into price ranges, traders can make more informed decisions about trade potential, risk management, and position sizing. The multi-timeframe approach ensures that traders can adapt their strategy to different market conditions and trading preferences.
When to explore it
This volatility indicator is most effective during periods of consistent market movement, where traditional price action might not provide clear directional signals. It works particularly well in markets with predictable volatility patterns, such as major currency pairs, stock indices, and liquid commodities.
Traders should pay special attention to the indicator during market open, after significant news events, or when transitioning between different trading sessions. The ranges can be especially useful for setting realistic profit targets, managing stop-loss levels, and understanding the potential price movement before entering a trade.
Keep exploring
What we’ve verified
Access, alerts and repainting behaviour have not been independently verified for this indicator. Check the creator’s current publication and settings.
General descriptions and classifications are recovered research. Verified details above identify the specific checks we have completed. Check the creator’s current publication for later changes.