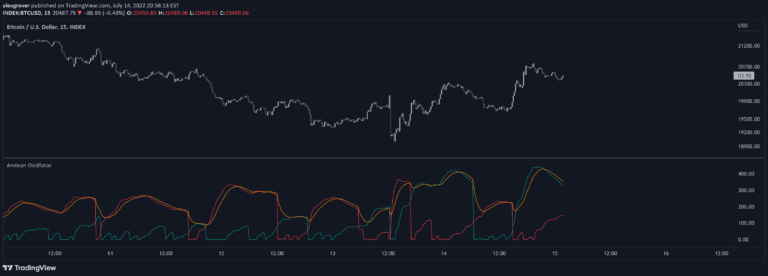
A Pearson's R indicator that visualizes long and short-term market trends through color-coded lines, helping traders identify trend strength and potential trading zones.
Explore complementary indicator rolesHow it works
The Pearson's R indicator calculates correlation coefficients to determine trend strength and direction. Long-term and short-term trends are represented by different colored lines. Red lines indicate downtrend potential, while green lines suggest uptrend potential.
The closer the value is to 1 or -1, the stronger the trend confirmation. White lines represent low confidence and potential sideways market conditions. Default trend length parameters are set at minimum 48 and maximum 360 periods
Why it may be useful
This indicator helps traders objectively assess market trends by quantifying trend strength and direction through statistical correlation. By providing visual representation of trend momentum, it reduces subjective interpretation of market movements.
Traders can quickly identify potential entry and exit points based on trend confidence levels. The color-coded system makes trend analysis more intuitive and accessible, especially for traders who struggle with interpreting raw statistical data
When to explore it
This indicator works best in markets with clear directional movements and sufficient price data. It is most effective during trending markets rather than choppy or highly volatile conditions. Traders should use it in conjunction with other technical analysis tools to confirm signals.
It is particularly useful for swing traders and day traders looking to identify trend strength and potential reversal points. The indicator can be applied across various financial instruments and timeframes
Keep exploring
What we’ve verified
Access, alerts and repainting behaviour have not been independently verified for this indicator. Check the creator’s current publication and settings.
General descriptions and classifications are recovered research. Verified details above identify the specific checks we have completed. Check the creator’s current publication for later changes.