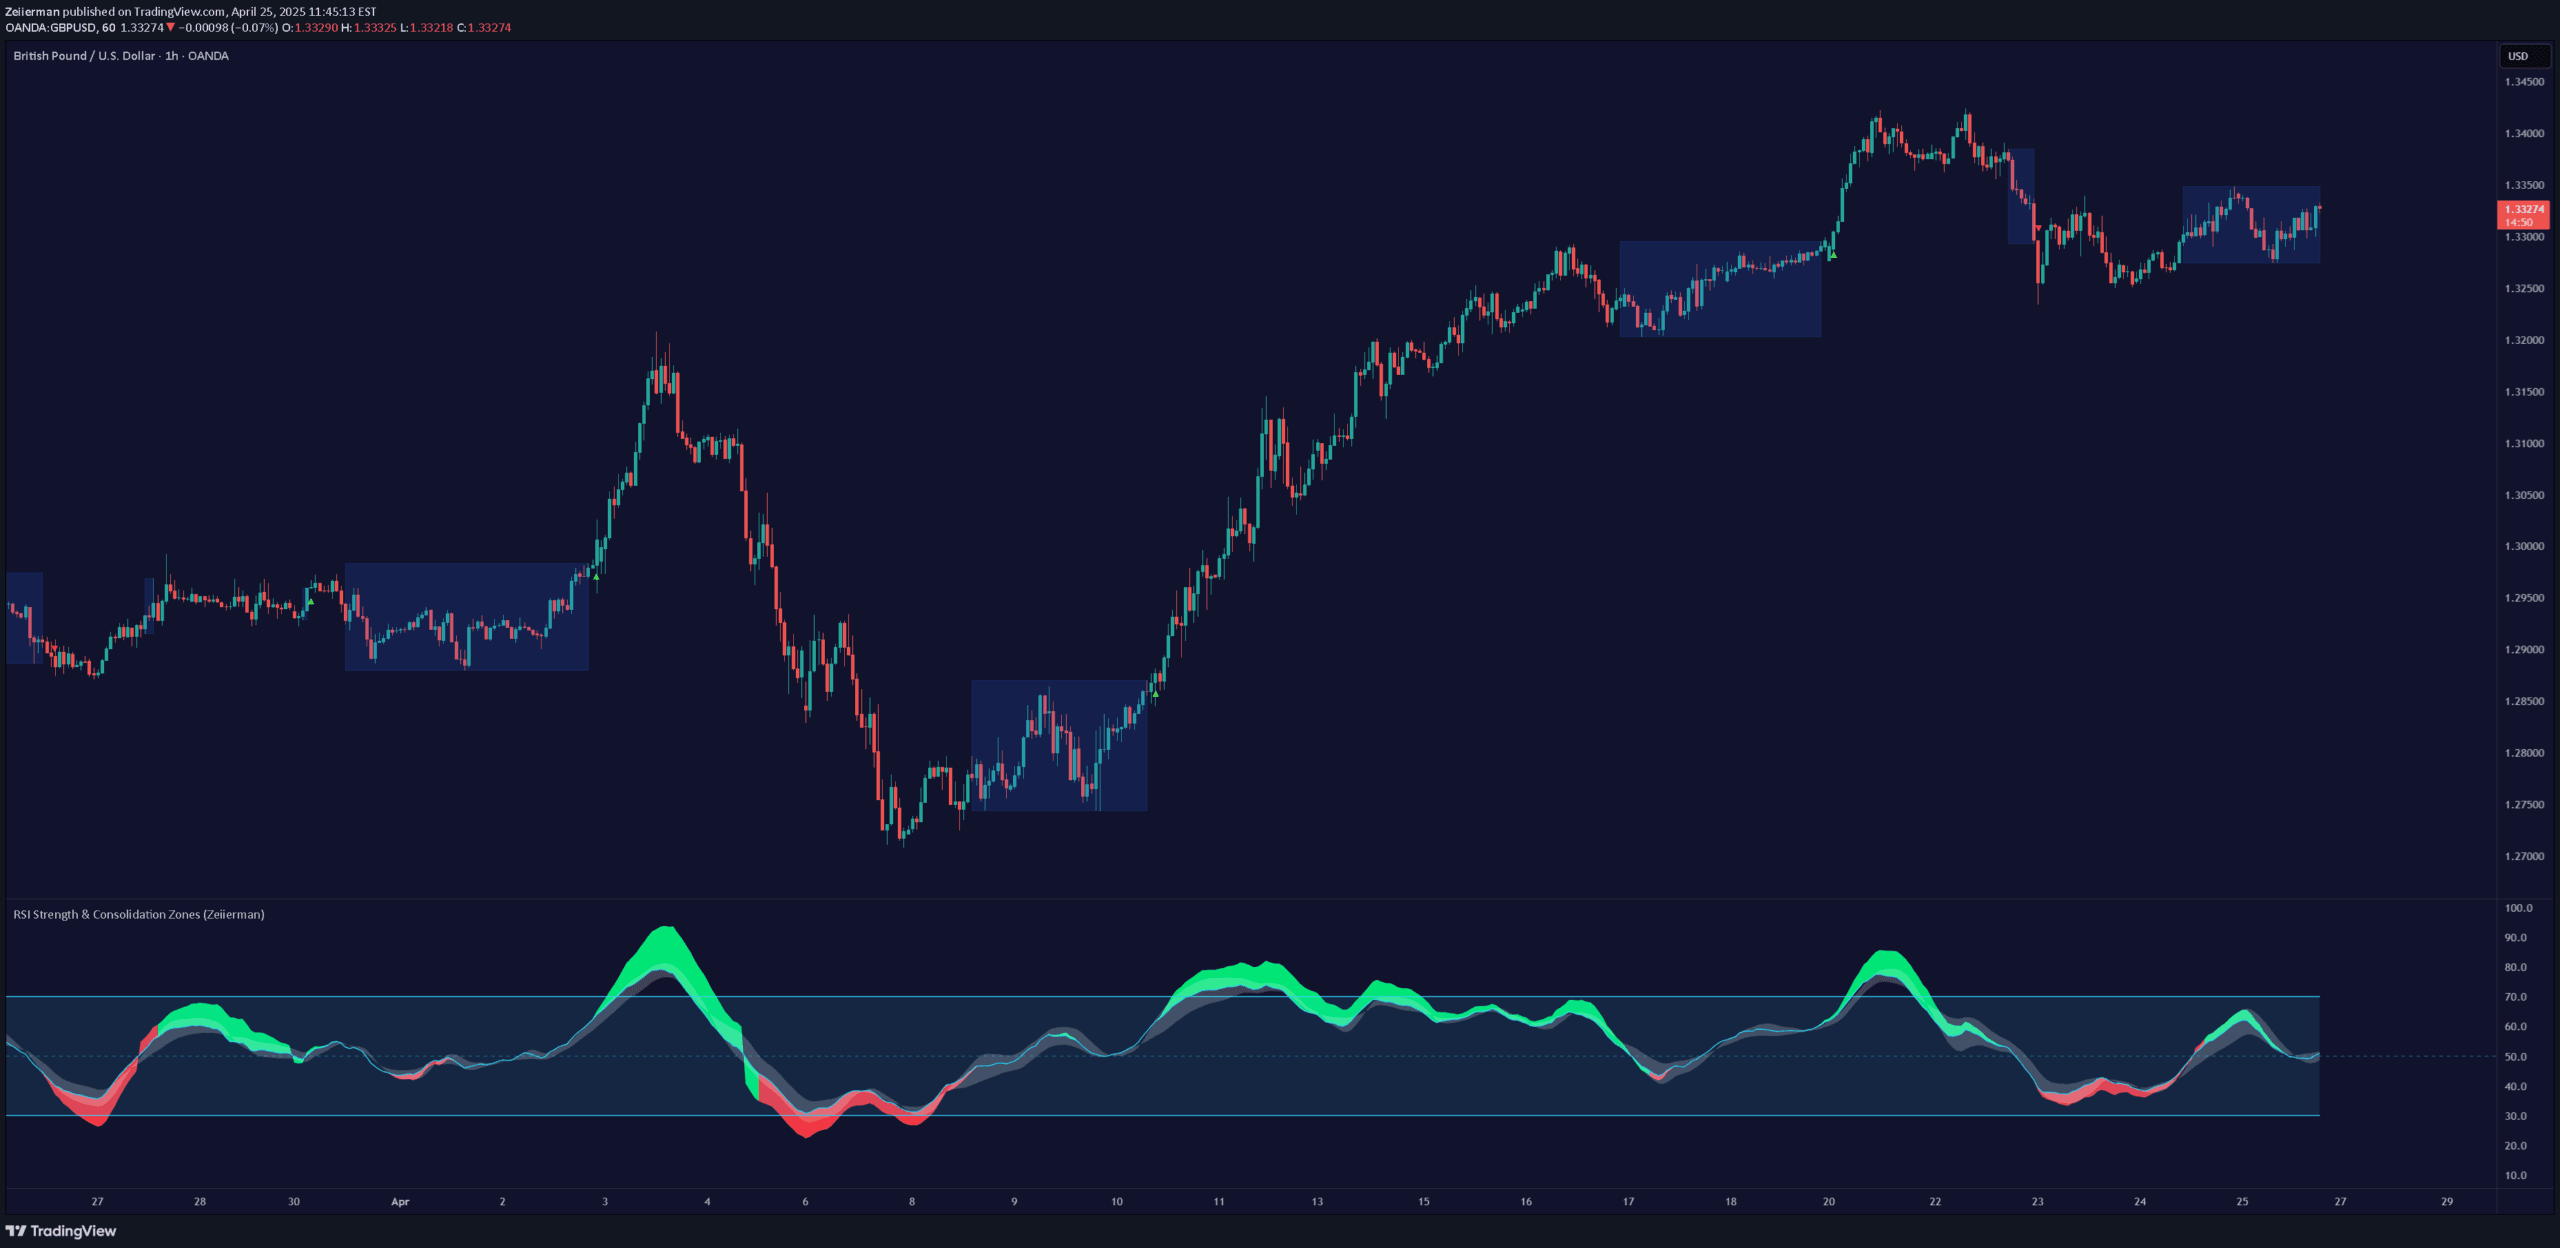
Advanced RSI tool that integrates momentum strength analysis, trend conviction measurement, and consolidation zone detection for more contextual market insights.
Explore complementary indicator rolesHow it works
The RSI Strength & Consolidation Zones indicator uses a sophisticated approach combining traditional and custom RSI calculations with Kalman filtering to create a dynamic momentum visualization. It smooths RSI through advanced filtering techniques, generating a more responsive trend representation that adapts to market conditions.
Additionally, the indicator incorporates Directional Movement Index (DMI) and Average Directional Index (ADX) to assess trend strength. When ADX exceeds 20, the RSI's visual representation is dynamically enhanced or dampened, providing traders with a nuanced view of directional momentum and potential market movements.
Why it may be useful
Traditional RSI indicators often lack contextual depth, merely showing overbought or oversold conditions without explaining underlying market dynamics. This advanced tool bridges that information gap by providing comprehensive insights into momentum strength, trend conviction, and potential market transitions.
By integrating multiple analytical techniques, the indicator helps traders understand not just price movement, but the structural context surrounding those movements. It transforms raw RSI data into a more meaningful narrative about market behavior, enabling more informed trading decisions.
When to explore it
The indicator works best during periods of potential trend transitions, particularly when markets are experiencing consolidation or preparing for significant breakouts. Traders should pay close attention to the consolidation zone detection, which highlights low-volatility periods that often precede substantial price movements.
Optimal usage occurs when combining the indicator's signals with other technical and fundamental analysis tools. The breakout markers and strength overlay are particularly useful for identifying early trend continuation or reversal opportunities across various timeframes and market conditions.
Keep exploring
What we’ve verified
Access, alerts and repainting behaviour have not been independently verified for this indicator. Check the creator’s current publication and settings.
General descriptions and classifications are recovered research. Verified details above identify the specific checks we have completed. Check the creator’s current publication for later changes.