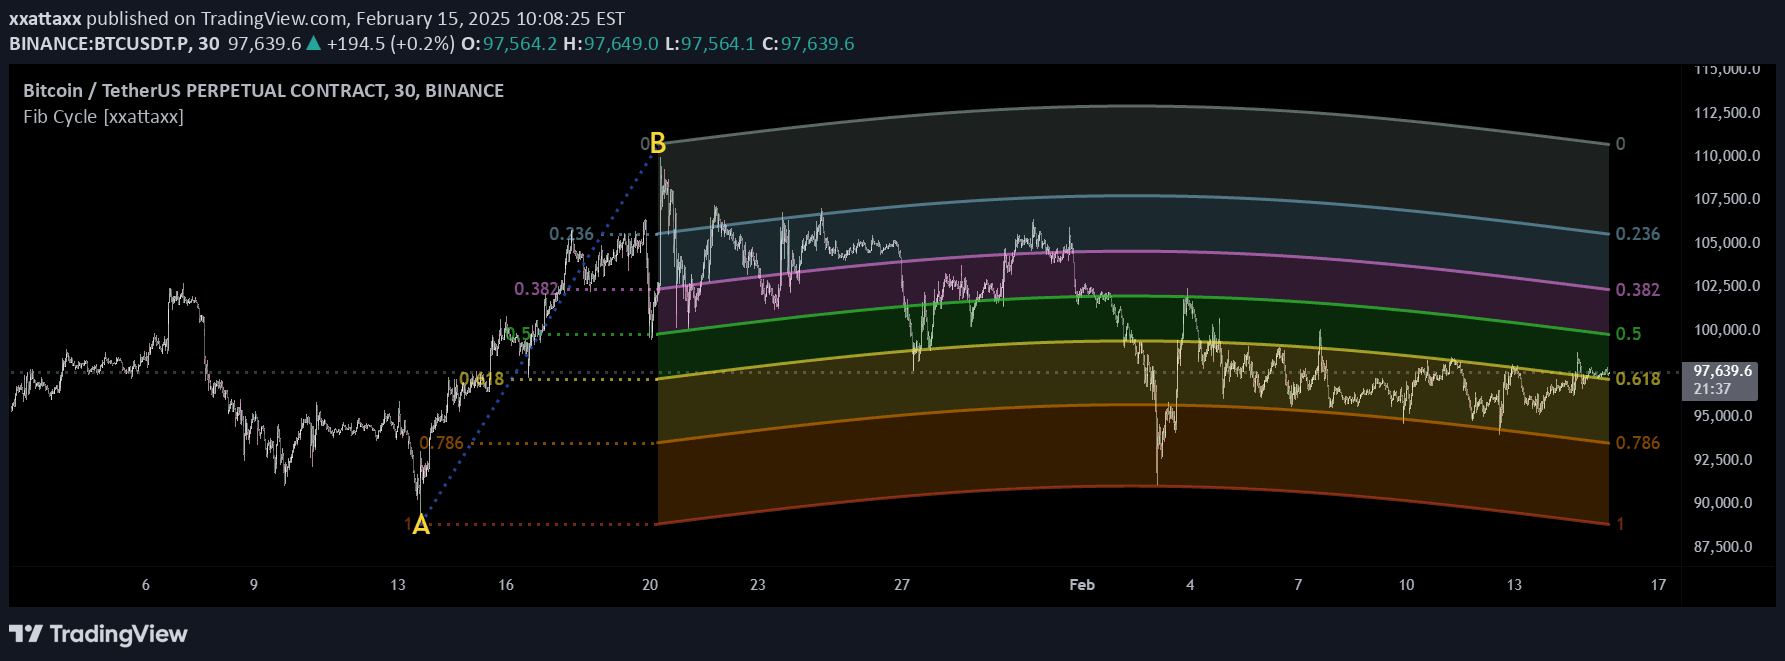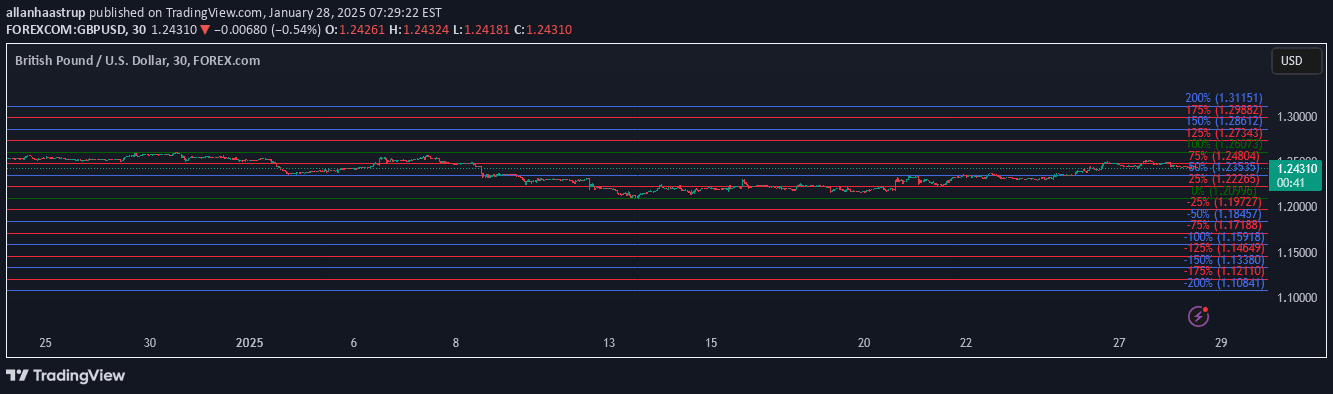
A fractal-based indicator that divides price charts into 25% levels, helping traders identify support and resistance zones across different timeframes and markets.
Explore complementary indicator rolesHow it works
The indicator analyzes price data from the past 5 weeks, identifying the highest high and lowest low as reference points. It then creates a percentage-based grid, dividing the price range into 0%, 25%, 50%, 75%, and 100% levels, with additional levels extending to 125%, 150%, 175%, and 200% above the highest high, and -25%, -50%, -75%, and -100% below the lowest low.
This automated system works across all charts and timeframes without requiring manual input. The levels are dynamically calculated and updated, providing a consistent visual framework for understanding price movement and potential support or resistance zones.
Why it may be useful
The indicator offers traders a systematic approach to visualizing price dynamics by breaking down market movements into digestible percentage levels. It provides a fractal perspective that helps traders understand how prices interact with different support and resistance zones, enabling more informed decision-making.
By presenting a clear, percentage-based grid, the indicator helps traders gain a broader perspective on market behavior. It allows for quick identification of potential turning points, breakout levels, and price reaction zones, which can be crucial for developing more strategic entry and exit points in trading.
When to explore it
This indicator is most effective when used in markets with clear trending or ranging characteristics, where price tends to respect defined levels. It works well across multiple asset classes, including stocks, forex, cryptocurrencies, and commodities, making it a versatile tool for different trading styles and strategies.
Traders can benefit most from this indicator when looking to identify potential support and resistance levels, confirm trend strengths, and make more informed decisions about market entry and exit points. It is particularly useful for traders who appreciate a systematic, percentage-based approach to understanding market dynamics.
Keep exploring
What we’ve verified
Access, alerts and repainting behaviour have not been independently verified for this indicator. Check the creator’s current publication and settings.
General descriptions and classifications are recovered research. Verified details above identify the specific checks we have completed. Check the creator’s current publication for later changes.