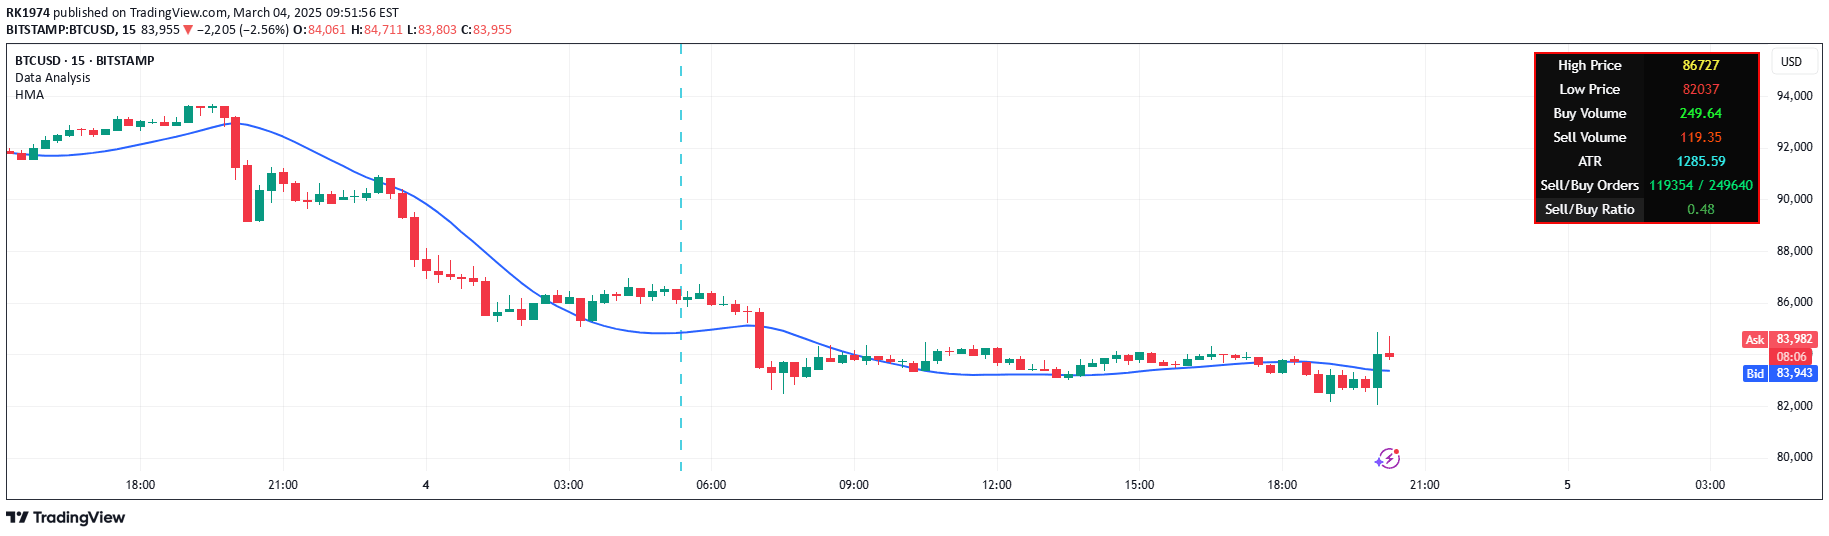
A TradingView script that allows tracking multiple stocks' average cost and performance simultaneously, providing real-time profit or loss visualization across different assets.
Explore complementary indicator rolesHow it works
The Average Cost script enables users to input multiple stock tickers, their corresponding average purchase costs, and share quantities into a single TradingView chart configuration. Once configured, the script calculates and visualizes the real-time profit or loss for each stock based on current market prices and the user's initial investment parameters.
By tracking multiple assets simultaneously, traders can quickly assess their portfolio's performance without needing separate calculations or spreadsheets. The script automatically updates the profit/loss metrics as market prices change, providing a dynamic and comprehensive overview of investment positions.
Why it may be useful
This script simplifies portfolio management by offering a consolidated view of multiple stock investments, allowing traders to monitor their performance efficiently. By presenting real-time profit and loss data, investors can make more informed decisions about holding, selling, or adjusting their positions based on current market conditions.
The tool's ability to track up to 50 stocks simultaneously provides unprecedented transparency and reduces the manual computational burden of tracking investment performance. This comprehensive approach helps investors maintain a clear understanding of their overall portfolio health and individual stock contributions.
When to explore it
The Average Cost script is most beneficial for investors managing diversified portfolios across different stocks and sectors. It proves particularly useful for those who want to maintain a real-time overview of their investments without constantly manually calculating gains or losses.
Traders and investors can leverage this tool during market hours to quickly assess their portfolio's performance, identify potential opportunities for rebalancing, and make data-driven investment decisions. It is especially valuable for those who prefer a comprehensive, at-a-glance view of their investment landscape.
Keep exploring
What we’ve verified
Access, alerts and repainting behaviour have not been independently verified for this indicator. Check the creator’s current publication and settings.
General descriptions and classifications are recovered research. Verified details above identify the specific checks we have completed. Check the creator’s current publication for later changes.