ADX and DI
ADX measures trend strength and direction by analyzing price movement. It helps traders identify the presence and power of a trend, indicating whether a market is trending or ranging.
Explore 11,183 indicators. Filter beyond the obvious.
Discover the tools that fit the way you trade.
11,183 tools to explore
ADX measures trend strength and direction by analyzing price movement. It helps traders identify the presence and power of a trend, indicating whether a market is trending or ranging.
A volume-based support and resistance indicator that identifies key trading levels through pivot points and volume analysis, providing visual cues for potential price reversals.
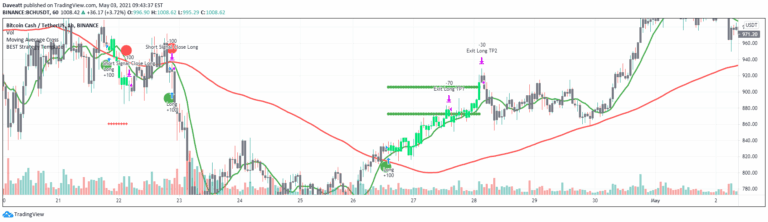
A 3Commas TradingView bot strategy offering automated trading with risk management, using moving average crossovers and customizable stop-loss and limit order settings.
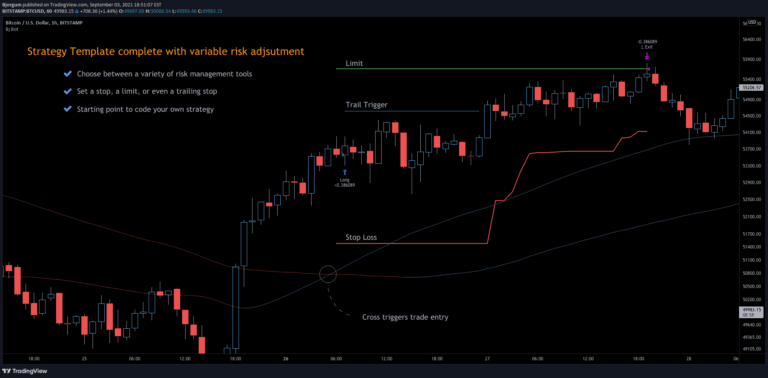
A universal strategy template for TradingView that allows traders to convert any indicator into a tradable strategy with comprehensive risk management and backtesting features.
A versatile divergence indicator that identifies potential trend reversals by comparing price action with an oscillator's momentum, adaptable to multiple technical indicators.
An advanced trading indicator that identifies trendline breakouts and breakdowns, providing precise entry signals, target calculations, and visual trade management tools.
An advanced trading strategy measuring the opening range of a trading session to identify potential breakout opportunities and determine market trend direction with precise entry and exit points.
Auto-generated Fibonacci Retracements that identify market structure shifts and potential support/resistance zones based on technical breaks and price action dynamics.
Global Liquidity Index tracks worldwide central bank balance sheets, providing a comprehensive view of global monetary conditions and potential market trends through consolidated financial data.
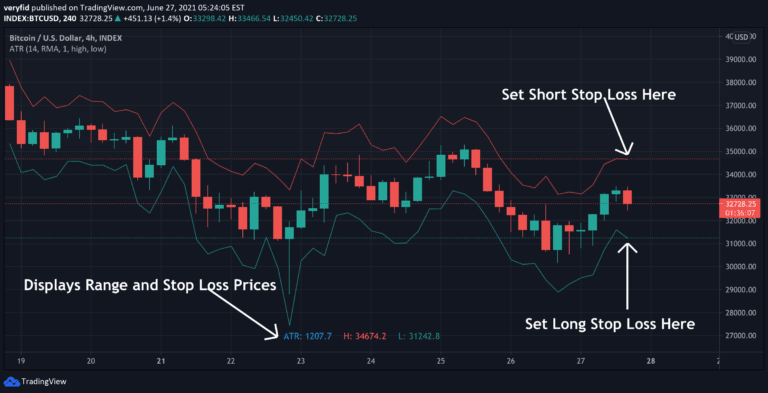
An ATR-based indicator that helps traders set adaptive stop losses by calculating safe exit points using volatility measurement. Prevents premature stop-outs and provides dynamic risk management.
A trading indicator that develops higher timeframe bias by analyzing previous day/week high and low price levels, providing a strategic approach to anticipating potential price movements.
An advanced stop-loss strategy that uses volume, price, and volatility to dynamically adjust stop-loss levels, helping traders manage risk by considering individual security characteristics.
Likes, views, and comments are historical TradingView snapshots. They describe attention, not trading performance.