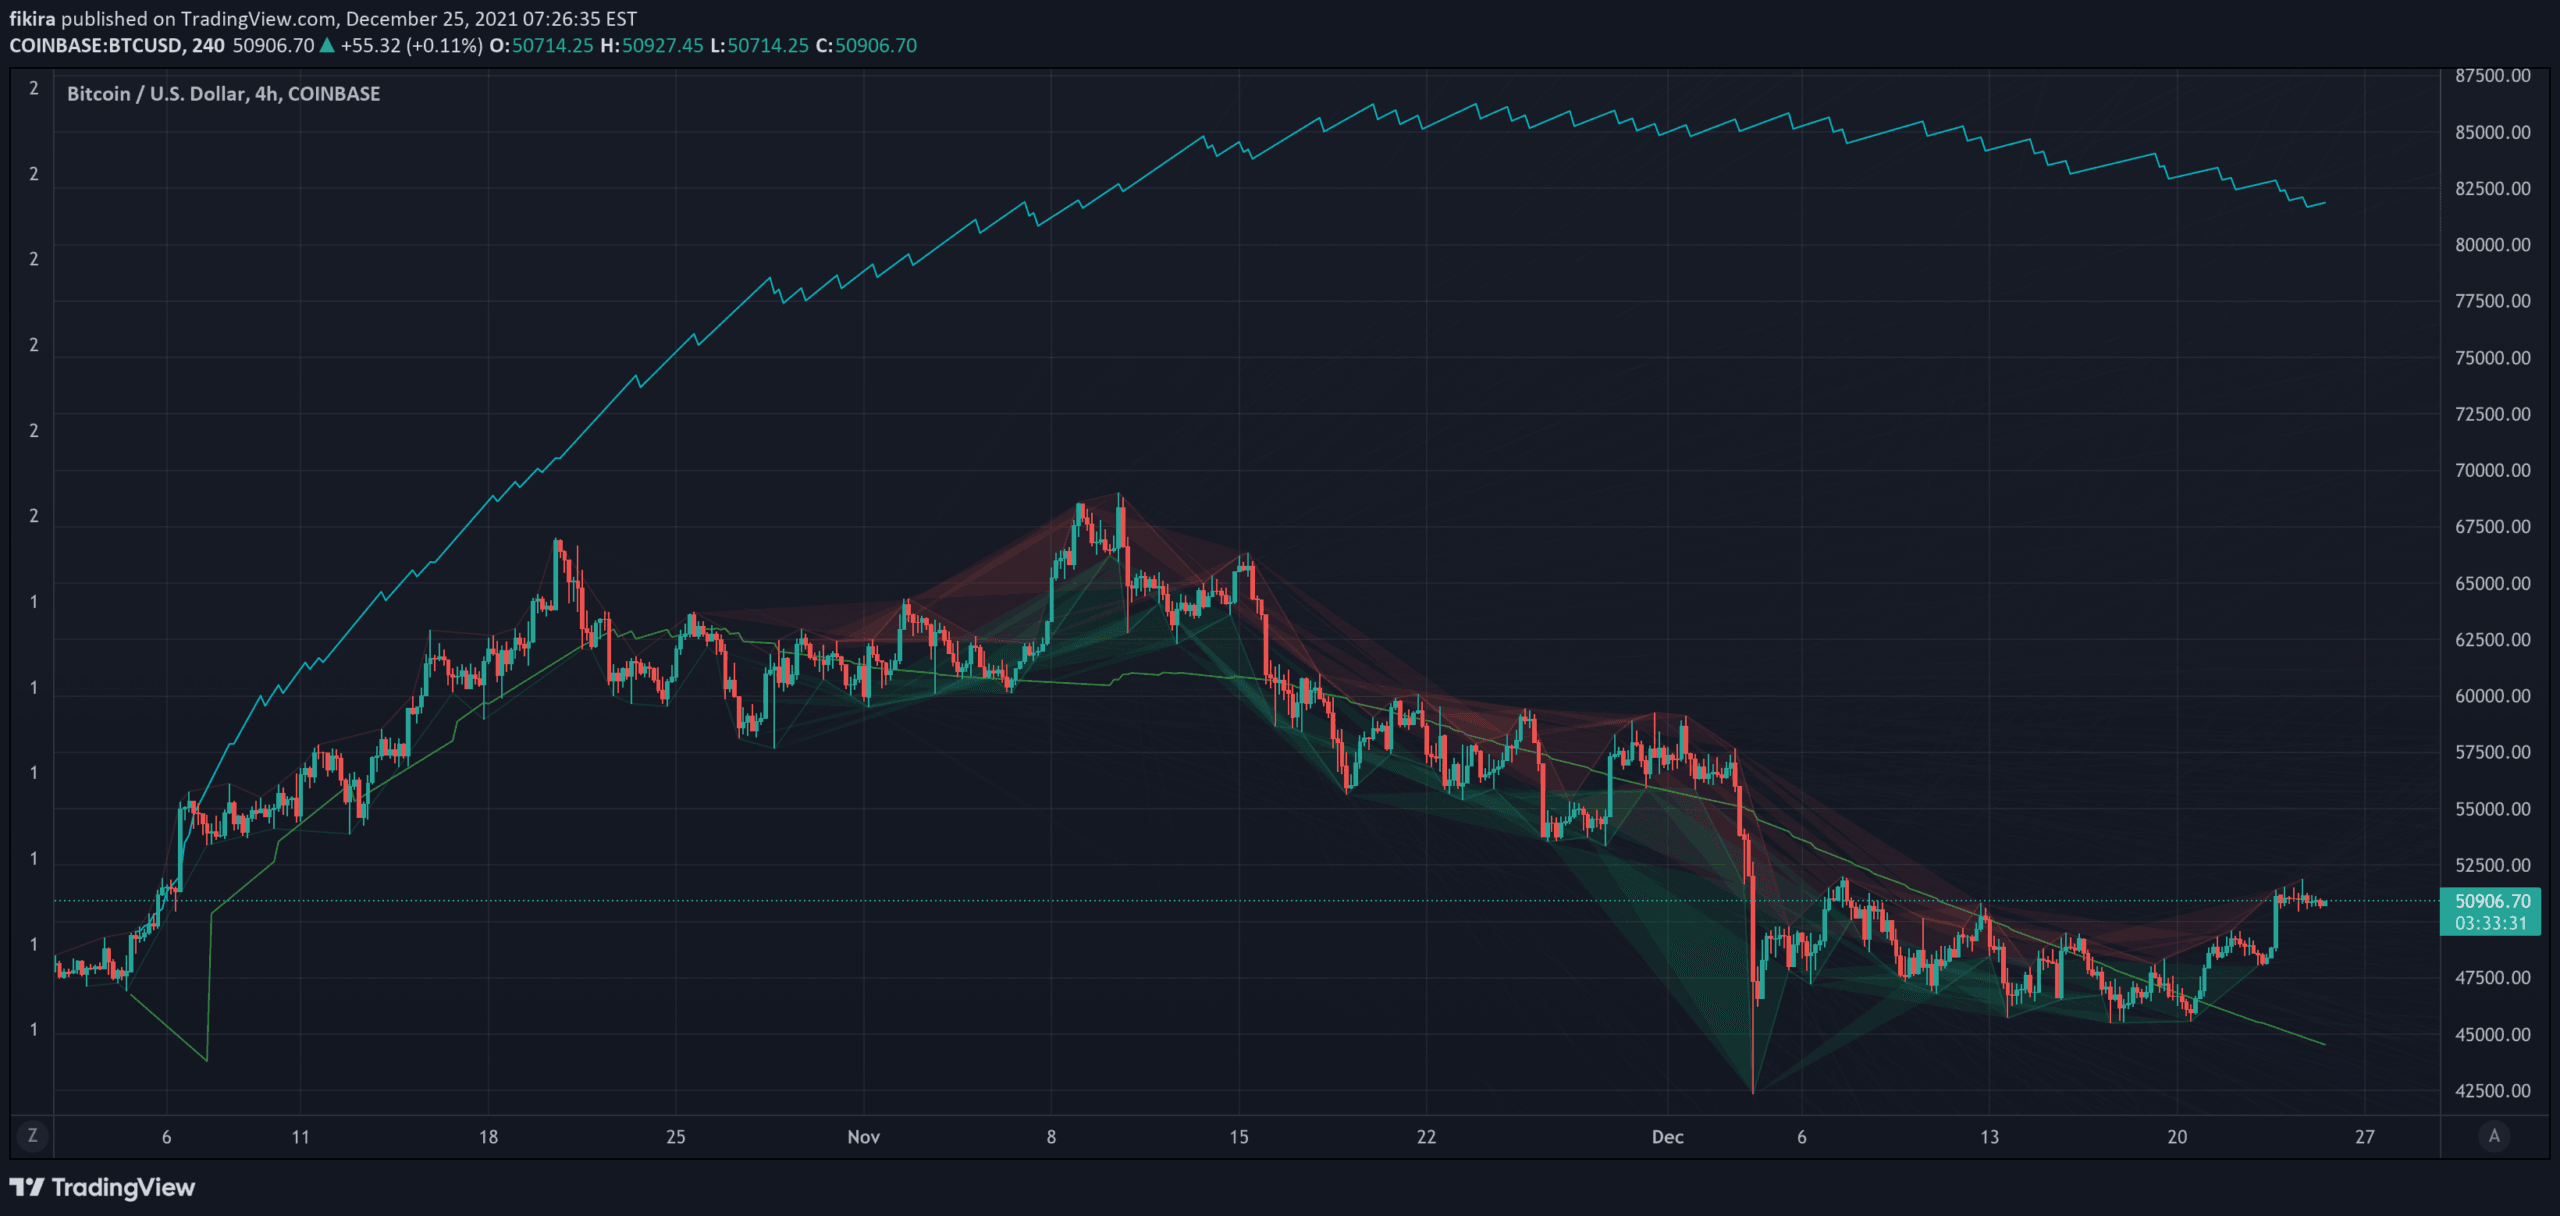
A unique moving average technique that creates average lines by connecting pivot points and extending them into the future, offering a dynamic way to analyze market trends and potential price movements.
Explore complementary indicator rolesHow it works
The indicator identifies pivot points in the price chart and creates lines connecting these points. Each line is extended into the future, creating multiple projected lines. As new bars are added, these lines are accumulated and averaged, generating a dynamic average line that adapts to changing market conditions.
The method goes beyond traditional moving averages by using pivot points as connection points. It can create average lines from more than 500 lines, though only 500 are visually displayed. The approach provides a flexible and adaptive trend analysis tool
Why it may be useful
This innovative approach to moving averages offers traders a more nuanced view of market trends. By using pivot points and extending lines into the future, it captures more complex price dynamics than traditional moving averages. The method provides insights into potential future price movements by averaging multiple projected lines.
It helps traders identify underlying trend directions and potential trend changes more dynamically. The technique can reveal subtle market movements that might be missed by conventional indicators. It offers a unique perspective on market trends and potential future price behavior
When to explore it
This indicator works best in markets with clear pivot points and trending characteristics. It is particularly useful for swing traders looking to identify longer-term trend directions. The method is most effective in markets with moderate volatility, where pivot points are more clearly defined.
Traders should use this indicator in conjunction with other technical analysis tools to confirm signals. It is less reliable in highly erratic or range-bound markets. The indicator can be especially helpful in identifying potential trend reversals and capturing multi-day price movements. Careful interpretation and complementary analysis are recommended
Keep exploring
What we’ve verified
Access, alerts and repainting behaviour have not been independently verified for this indicator. Check the creator’s current publication and settings.
General descriptions and classifications are recovered research. Verified details above identify the specific checks we have completed. Check the creator’s current publication for later changes.