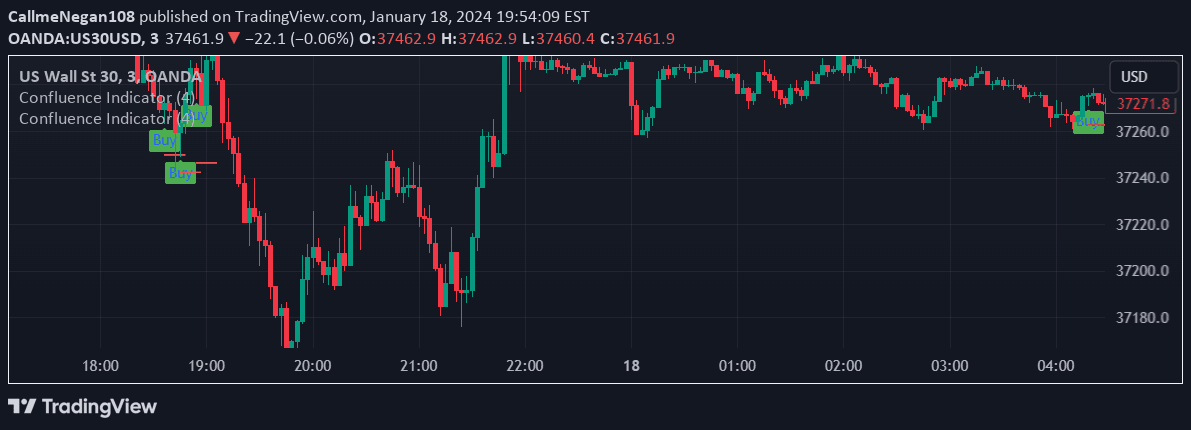
The B-Xtrender Simplified indicator identifies potential buy and sell opportunities by combining short-term and long-term RSI-based oscillators with exponential moving averages to detect trend shifts.
Explore complementary indicator rolesHow it works
The B-Xtrender Simplified indicator uses multiple oscillators to generate trading signals. It starts by calculating a short-term oscillator using the RSI of the difference between two exponential moving averages (EMAs), which measures immediate momentum and potential trend reversals.
The indicator then applies a long-term oscillator using the RSI of a single EMA to confirm the broader market trend. A smoothed oscillator is added to reduce noise and increase signal reliability, ensuring that buy and sell signals are generated only when short-term momentum, smoothed momentum, and long-term trend align.
Why it may be useful
Traders benefit from the B-Xtrender Simplified indicator because it provides clear, actionable signals based on multiple momentum and trend confirmations. By combining short-term and long-term oscillators, the indicator reduces the likelihood of false signals and helps traders make more informed decisions.
The visual simplicity of the indicator, with green and red arrows marking potential entry points, makes it accessible to traders of all experience levels. Its confluence-based approach ensures that signals are generated only when multiple technical conditions are met, which can increase the probability of successful trades.
When to explore it
The B-Xtrender Simplified indicator works best in liquid markets with clear trending characteristics. It is particularly effective when used on higher timeframes like 1-hour or daily charts to confirm overall trend direction and potential entry points.
Traders should combine this indicator with other technical analysis tools such as support and resistance levels, volume analysis, or additional technical indicators to enhance signal accuracy. It is most suitable for trend-following strategies and traders seeking a straightforward, momentum-based approach to identifying potential trade opportunities.
Keep exploring
What we’ve verified
Access, alerts and repainting behaviour have not been independently verified for this indicator. Check the creator’s current publication and settings.
General descriptions and classifications are recovered research. Verified details above identify the specific checks we have completed. Check the creator’s current publication for later changes.