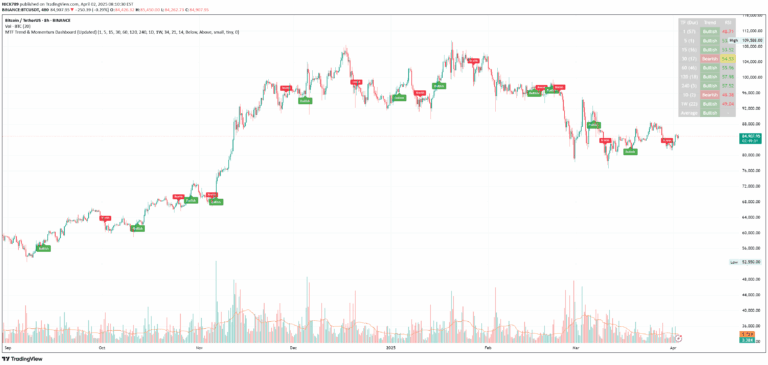
A trend indicator using two linear regressions of different lengths to analyze market trends by comparing current and past price movements and generating buy or sell signals.
Explore complementary indicator rolesHow it works
The indicator operates by utilizing two linear regression lines with different lengths: a longer 100-period regression and a shorter 30-period regression. These lines track price movements and help identify trend dynamics by showing how current and past price trends interact.
When the two linear regression lines cross each other, they generate trading signals. The shorter regression line acts as a resistance or threshold, and crossovers indicate potential buy or sell opportunities based on the interaction between current and past trend lines.
Why it may be useful
This trend indicator provides traders with a visual representation of market momentum by comparing current and historical price movements. It helps identify potential trend changes and market direction more effectively than single linear regression approaches.
By combining past and present trend information, traders can make more informed decisions about market entry and exit points. The indicator's ability to generate clear visual signals through color-coded arrows makes trend identification more intuitive and accessible.
When to explore it
The indicator is most effective in markets with clear trending behavior, where price movements show consistent directional momentum. It works best in timeframes that allow for short to medium-term trend analysis, such as intraday and swing trading scenarios.
Traders should be cautious when using this indicator during sideways or highly volatile market conditions, as the signals might be less reliable. It is recommended to combine this indicator with other technical analysis tools to confirm signals and reduce false trend predictions.
Keep exploring
What we’ve verified
Access, alerts and repainting behaviour have not been independently verified for this indicator. Check the creator’s current publication and settings.
General descriptions and classifications are recovered research. Verified details above identify the specific checks we have completed. Check the creator’s current publication for later changes.