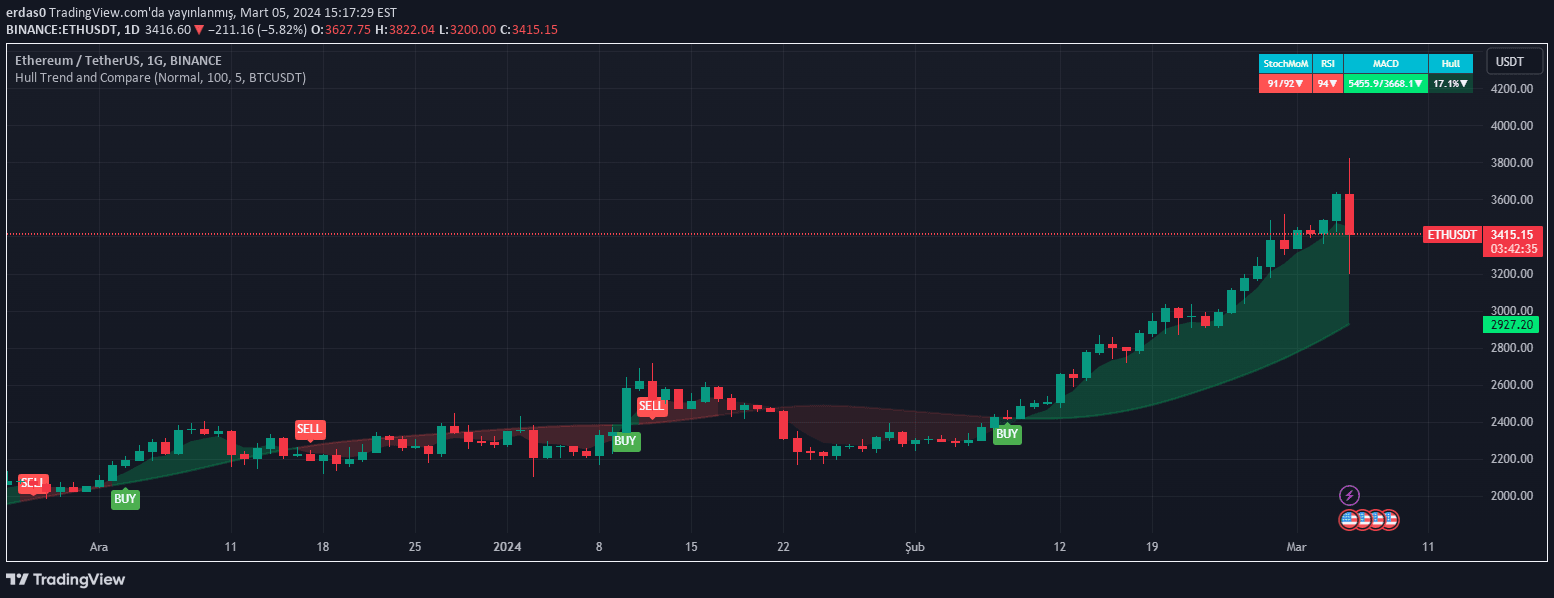
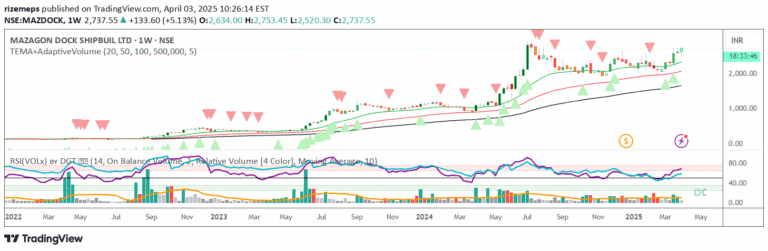
A custom technical analysis indicator using Exponential Moving Averages and an RSI-like Operation Line to generate trade signals and identify market trend directions and potential turning points.
Explore complementary indicator rolesHow it works
The L2 Bull and Bear Heaven Line script operates using two Exponential Moving Averages (EMAs): a longer-term Heaven Line and a shorter-term Trading Line. When the Trading Line crosses above the Heaven Line, it generates a buy signal, and when it crosses below, it produces a sell signal. The script also incorporates an Operation Line similar to RSI to provide additional market insights.
The indicator tracks price movements and trend directions by analyzing the relationship between these two EMA lines. By monitoring the crossovers and the Operation Line's position, traders can identify potential market turning points and assess the current momentum of the asset being traded.
Why it may be useful
Technical analysis indicators like the L2 Bull and Bear Heaven Line help traders make more informed decisions by providing objective insights into market trends and potential price movements. By combining multiple technical tools such as EMAs and an RSI-like oscillator, the script offers a comprehensive view of market dynamics that goes beyond simple price action.
The indicator's ability to generate clear buy and sell signals, along with its trend identification capabilities, can help traders reduce emotional decision-making and develop more systematic trading strategies. It provides a structured approach to understanding market momentum and potential trend reversals.
When to explore it
This indicator is most effective in markets with clear trending characteristics, where price movements are more pronounced and directional. It works best in moderately volatile markets where trends can be more easily identified and tracked by moving average crossovers. Traders should consider using this script in markets like forex, stocks, and cryptocurrencies.
The L2 Bull and Bear Heaven Line is particularly useful for traders who prefer a systematic approach to market analysis and want to combine multiple technical indicators. It is recommended to backtest the strategy in different market conditions and timeframes to understand its performance and potential limitations.
Keep exploring
What we’ve verified
Access, alerts and repainting behaviour have not been independently verified for this indicator. Check the creator’s current publication and settings.
General descriptions and classifications are recovered research. Verified details above identify the specific checks we have completed. Check the creator’s current publication for later changes.