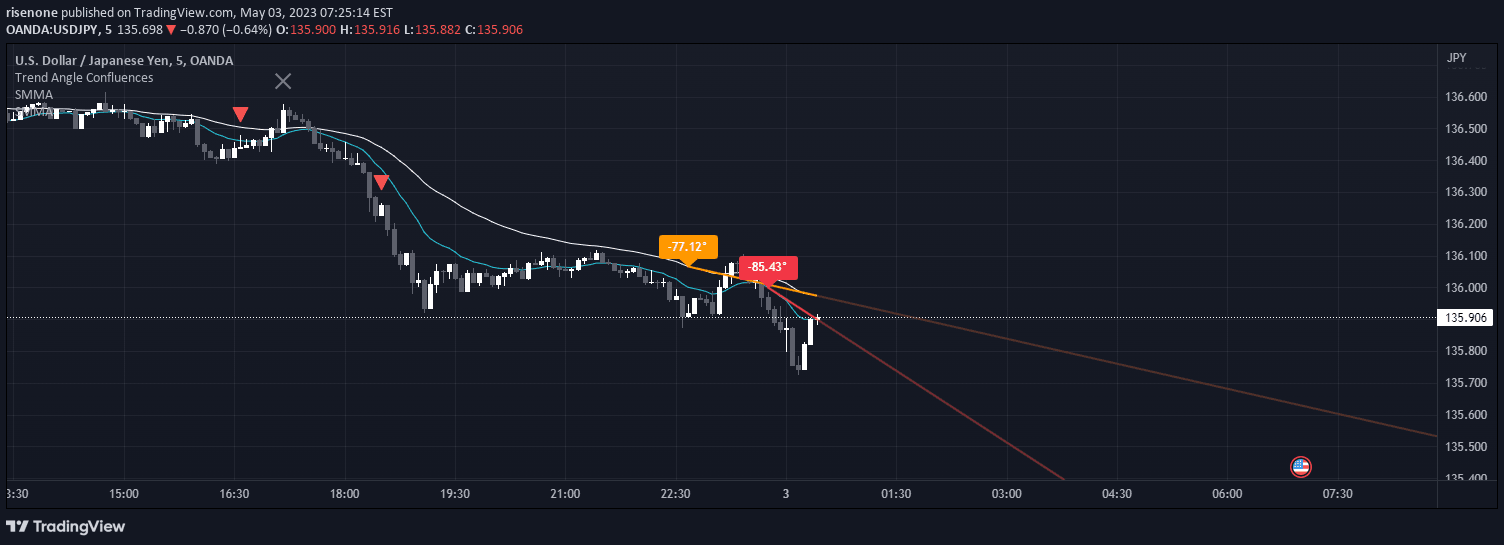
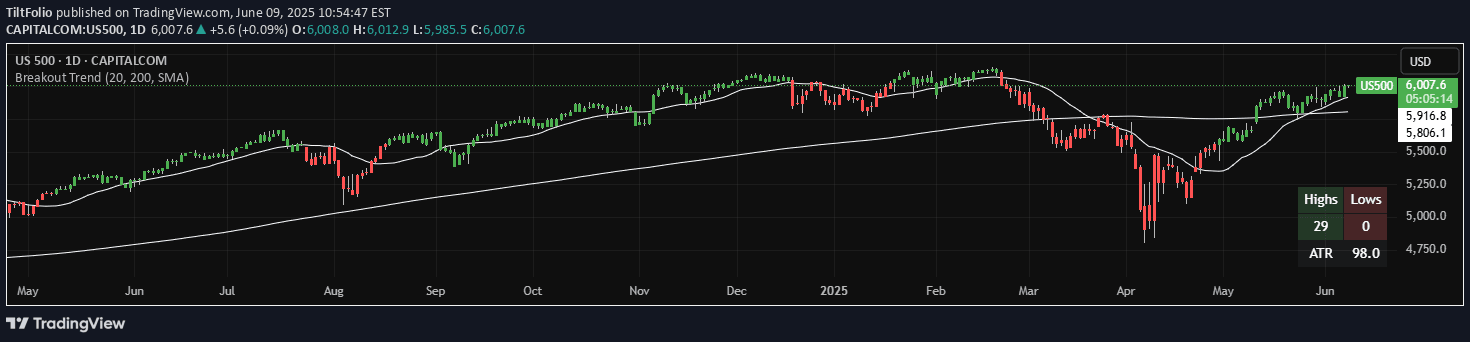
A market analysis indicator using EMAs and custom calculations to identify potential tops, bottoms, and trend changes with multiple visual lines and signals.
Explore complementary indicator rolesHow it works
The Top and Bottom Divine Judgment indicator operates by calculating multiple exponential moving averages (EMAs) and simple moving averages (SMAs) across different periods. It generates specialized lines representing bullish and bearish trends through custom calculations using high and low prices.
The indicator creates various visual elements like colored lines, histograms, and shapes to represent market conditions. These include bullish and bearish EMAs, a midpoint boundary line, and specialized lines indicating market states such as danger, caution, and potential reversal points.
Why it may be useful
Traders benefit from this indicator's comprehensive market analysis approach, providing multiple perspectives on potential trend changes and market conditions simultaneously. By integrating various technical calculations, it offers a more nuanced view of price movements beyond traditional single-metric indicators.
The visual representations help traders quickly identify complex market scenarios, reducing decision-making time and potentially improving trade entry and exit strategies. Its multi-layered analysis approach allows for more informed trading decisions by considering multiple technical factors concurrently.
When to explore it
This indicator works best in markets with clear trend transitions and moderate volatility, where multiple technical signals can provide meaningful insights. It is particularly useful for traders seeking a holistic view of market conditions beyond simple trend identification.
Optimal usage includes combining the indicator with other technical and fundamental analysis tools to confirm signals and manage risk effectively. Traders should be cautious and backtest the strategy across different market conditions and assets before implementing it in live trading.
Keep exploring
What we’ve verified
Access, alerts and repainting behaviour have not been independently verified for this indicator. Check the creator’s current publication and settings.
General descriptions and classifications are recovered research. Verified details above identify the specific checks we have completed. Check the creator’s current publication for later changes.