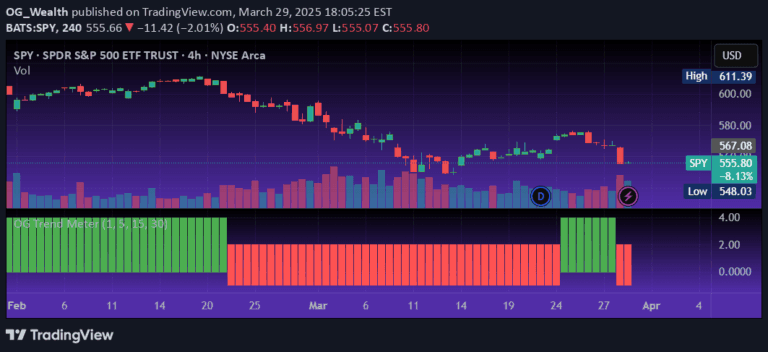
A technical analysis tool that visualizes price and volume trends through moving averages and color-coded histograms, helping traders identify potential market entry and exit points.
Explore complementary indicator rolesHow it works
The L2 Wave Base Camp indicator operates by calculating moving averages and relative strength to create a visual representation of market trends. It uses color-coded histograms to display price positioning relative to key moving averages, with different colors indicating varying market conditions.
The indicator generates labeled signals at 'Valley' and 'Top' points, suggesting potential trading opportunities. By incorporating volume data analysis, it helps traders identify potential trend reversals and assess the strength of market movements through comprehensive visual and numerical data.
Why it may be useful
Traders benefit from this indicator's ability to simplify complex market data into an easily interpretable visual format. It provides a quick and intuitive way to understand market trends, helping traders make more informed decisions by presenting price and volume information in a clear, color-coded manner.
The tool's strength lies in its ability to combine multiple analytical elements, including moving averages, relative strength, and volume trends, into a single comprehensive view. This multifaceted approach allows traders to gain deeper insights into market dynamics and potential trading opportunities.
When to explore it
The L2 Wave Base Camp indicator is most effective in markets with clear trending conditions, where moving averages and volume trends can provide meaningful signals. It works best when used alongside other technical analysis tools, helping traders confirm potential entry and exit points.
Traders should apply this indicator in markets with sufficient liquidity and trading volume, where the volume and price trend analysis can generate reliable signals. It is particularly useful for short to medium-term trading strategies, especially in markets that demonstrate consistent directional movement.
Keep exploring
What we’ve verified
Access, alerts and repainting behaviour have not been independently verified for this indicator. Check the creator’s current publication and settings.
General descriptions and classifications are recovered research. Verified details above identify the specific checks we have completed. Check the creator’s current publication for later changes.