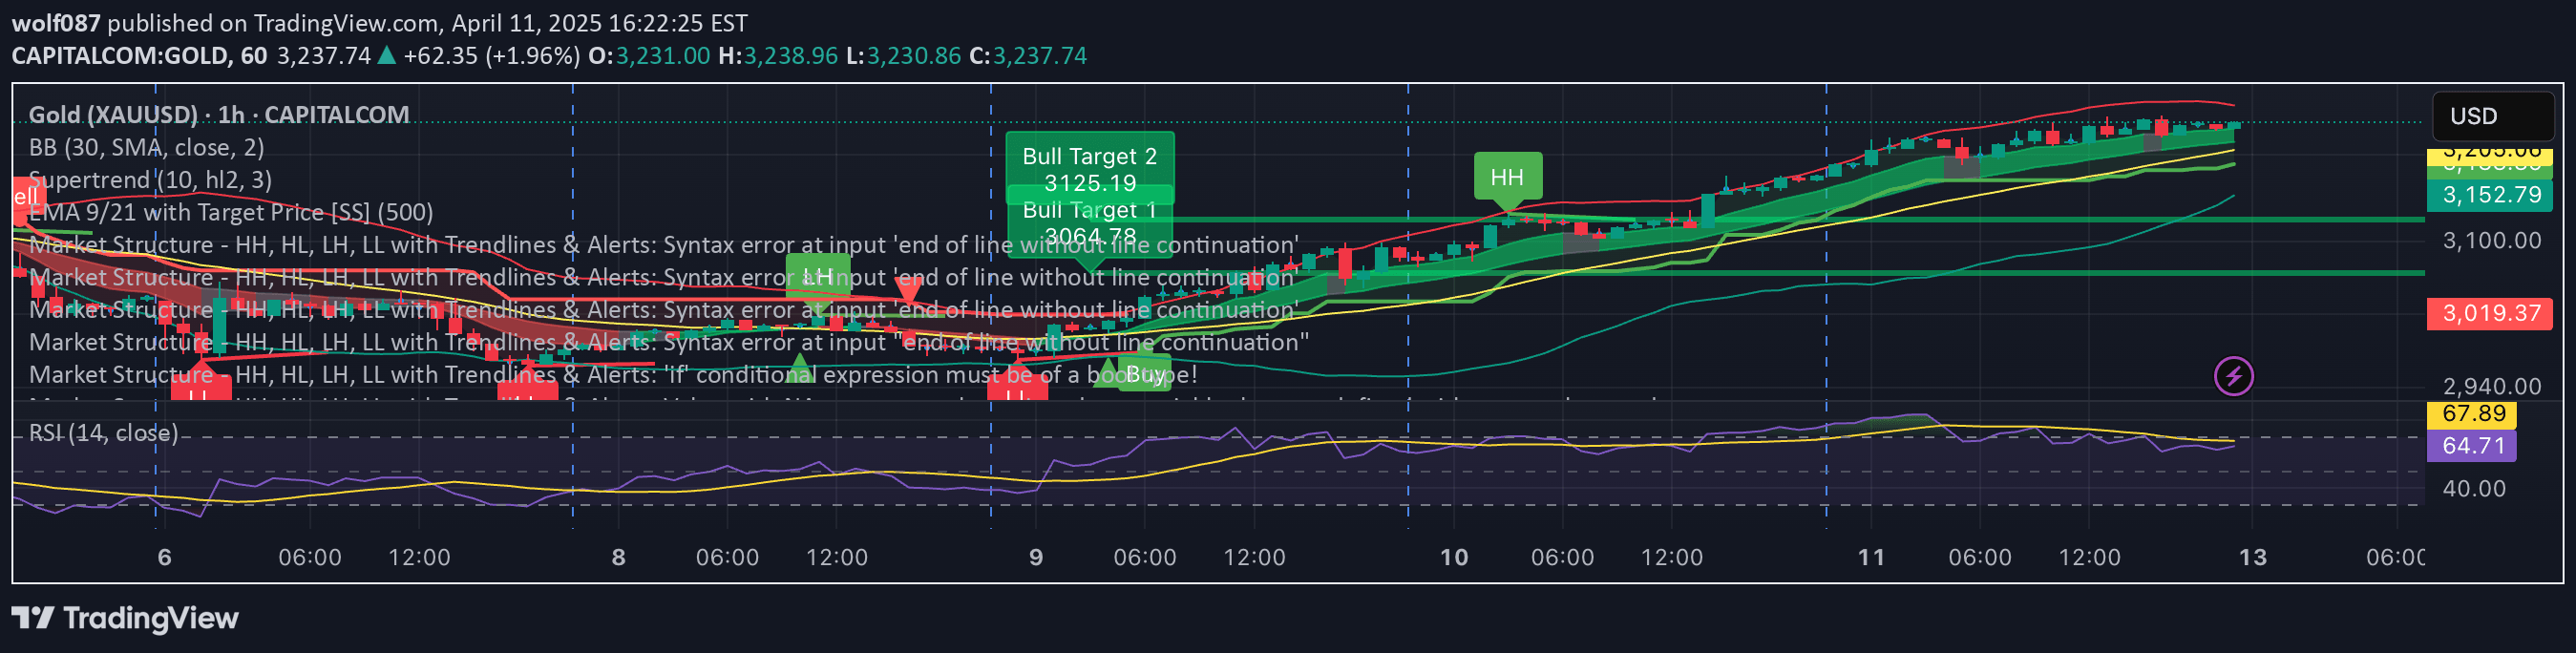
A sequential price pattern indicator that identifies potential buy and sell signals by tracking consecutive price movements and highlighting overbought or oversold market conditions.
Explore complementary indicator rolesHow it works
The L3 Magic-9 Sequential indicator analyzes price movements by tracking consecutive bar sequences across different lengths ranging from 5 to 13 bars. It calculates price differences and identifies specific sequential patterns that could indicate potential trend changes or momentum shifts in the market.
The indicator plots characters and shapes directly on the chart to visually represent detected sequences, using custom functions to recognize both bullish and bearish movement patterns. It generates buy and sell labels based on filtered occurrences and assigns background colors to highlight overbought and oversold market conditions.
Why it may be useful
Sequential pattern recognition helps traders identify potential market turning points by systematically tracking price movement consistency and momentum. By visualizing recurring price sequences, traders can gain insights into possible trend reversals and potential entry or exit points before they become obvious to the broader market.
The indicator's ability to quantify and highlight sequential patterns provides traders with a structured approach to analyzing price action, reducing subjective interpretation and offering a more methodical framework for identifying trading opportunities across different market conditions.
When to explore it
The indicator is most effective in trending markets with clear directional momentum, where sequential price patterns can reveal potential trend continuation or reversal signals. Traders should prioritize using this tool in markets showing consistent price movement rather than choppy, range-bound environments.
Optimal usage involves combining the sequential signals with other technical analysis tools to confirm potential trade setups. Traders should be particularly cautious during periods of low volatility or market consolidation, where sequential patterns may generate less reliable signals.
Keep exploring
What we’ve verified
Access, alerts and repainting behaviour have not been independently verified for this indicator. Check the creator’s current publication and settings.
General descriptions and classifications are recovered research. Verified details above identify the specific checks we have completed. Check the creator’s current publication for later changes.