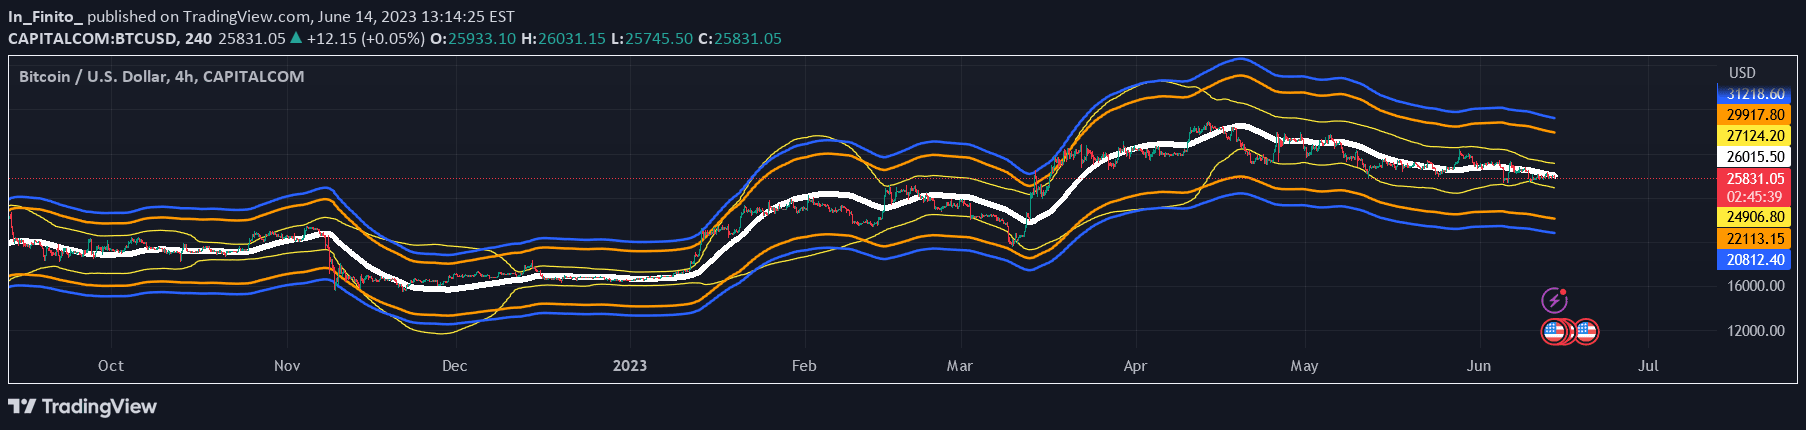
Bollinger Bands measure price volatility using standard deviation bands around a moving average, helping traders identify potential price breakouts and trend changes.
Explore complementary indicator rolesHow it works
Bollinger Bands consist of three lines plotted on a price chart: a middle basis line (typically a 20-period simple moving average), an upper band, and a lower band. The upper and lower bands are calculated by adding and subtracting two standard deviations from the basis line, which dynamically adjusts to price volatility.
The indicator calculates two key metrics: Bollinger Band Percent (measuring the closing price's position relative to the bands) and Bollinger Band Width (measuring the bands' relative width). These metrics help traders understand price movement and potential market conditions by showing how far price has traveled from its average.
Why it may be useful
Bollinger Bands provide traders with a visual representation of market volatility and potential price movement trends. By showing how prices interact with statistical bands, traders can identify potential overbought or oversold conditions, trend reversals, and periods of price compression or expansion.
The indicator helps traders make more informed decisions by offering insights into market dynamics, potential breakout points, and trend strength. It allows for quick visual assessment of price behavior relative to historical volatility, enabling more strategic entry and exit points in trading.
When to explore it
Bollinger Bands are most effective in markets with clear trending or ranging characteristics, particularly in liquid and moderately volatile markets like forex, stocks, and futures. Traders find them especially useful during periods of price consolidation or when seeking to identify potential trend reversals and breakout opportunities.
The indicator works best when combined with other technical analysis tools to confirm signals, such as momentum indicators or trend-following strategies. Traders should be cautious during extreme market conditions or in highly unpredictable markets where traditional volatility measurements might provide less reliable insights.
Keep exploring
What we’ve verified
Access, alerts and repainting behaviour have not been independently verified for this indicator. Check the creator’s current publication and settings.
General descriptions and classifications are recovered research. Verified details above identify the specific checks we have completed. Check the creator’s current publication for later changes.