
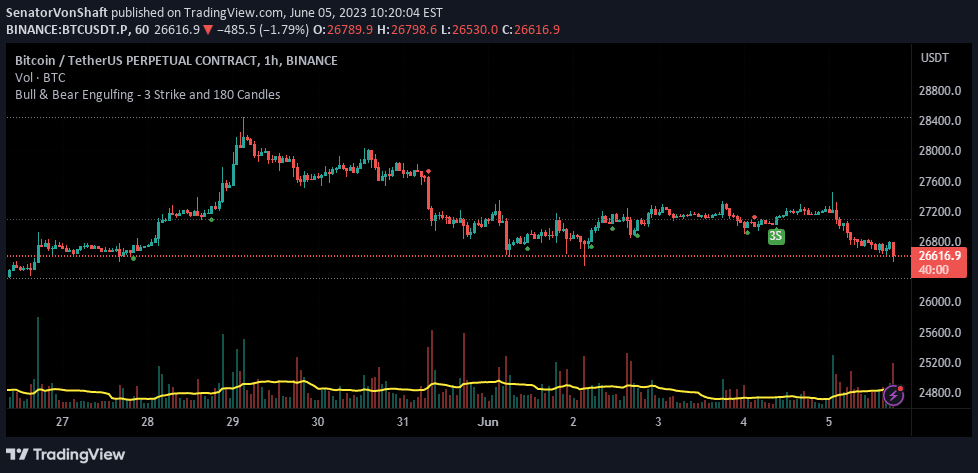
A candlestick pattern indicator identifying multiple bullish and bearish formations through analyzing candle characteristics like size, fullness, and relative positioning.
Explore complementary indicator rolesHow it works
The indicator analyzes candlestick formations by examining three key variables: bar fullness, average backward candle weight, and bar height multiplier. It identifies specific candlestick patterns like engulfing candles, where one candle completely covers the previous candle's body, signaling potential trend reversals.
The system generates visual signals through colored arrows representing different formations: green and red arrows for engulfing candles, green and red 180-degree indicators for larger opposite candles, and green and red 3S markers for three-strike candle patterns.
Why it may be useful
Candlestick pattern recognition provides traders with rapid visual insights into potential market sentiment shifts and momentum changes. By highlighting specific formations, traders can quickly identify potential entry and exit points without complex technical analysis.
These patterns offer a quick snapshot of market psychology, revealing moments where buying or selling pressure might be intensifying. The multi-formation approach allows traders to capture different types of market movements and potential trend reversals across various timeframes.
When to explore it
This indicator is most effective during periods of moderate market volatility where clear trend transitions are likely to occur. Traders should use it in conjunction with other technical indicators to confirm potential signals and reduce false positive readings.
The tool works best on timeframes ranging from 1-minute to 4-hour charts, particularly for assets with consistent trading volume. Ideal application includes forex, cryptocurrency, and stock markets where price action patterns are more pronounced and predictable.
Keep exploring
What we’ve verified
Access, alerts and repainting behaviour have not been independently verified for this indicator. Check the creator’s current publication and settings.
General descriptions and classifications are recovered research. Verified details above identify the specific checks we have completed. Check the creator’s current publication for later changes.


